Create an Alert System
In this step, we will create an alert system using CloudWatch Alarm, a service that helps us detect and notify when metrics exceed thresholds.
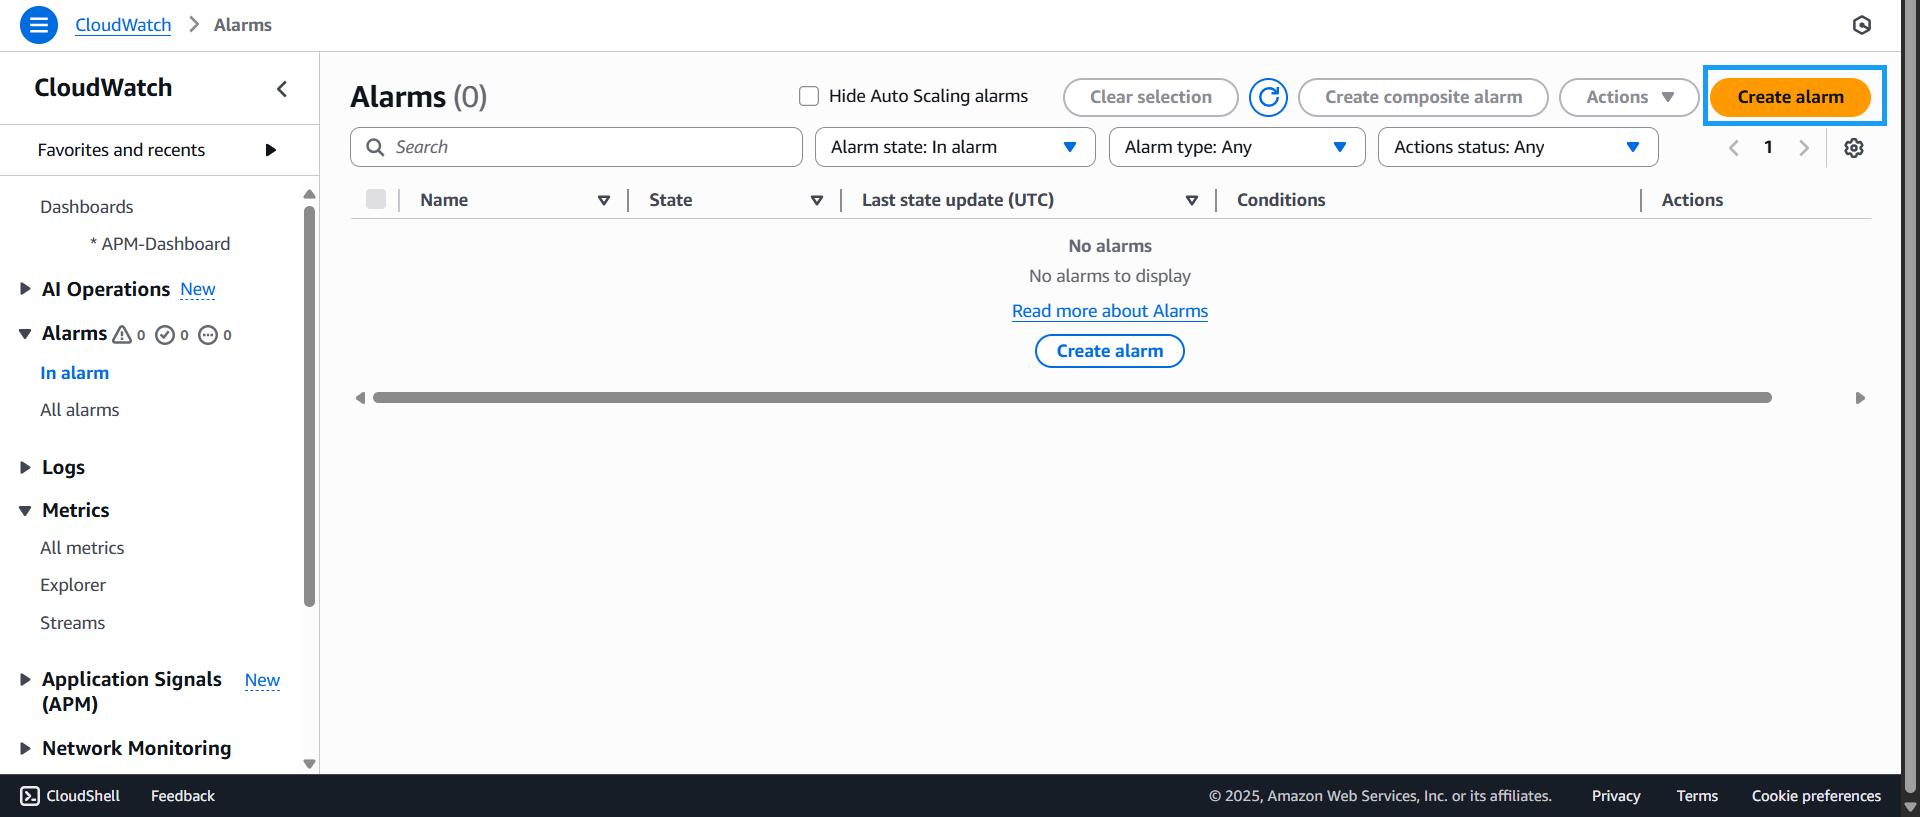
- Go to the CloudWatch Console
- Under the Alarms section, click on In alarm
- Then click Create alarm
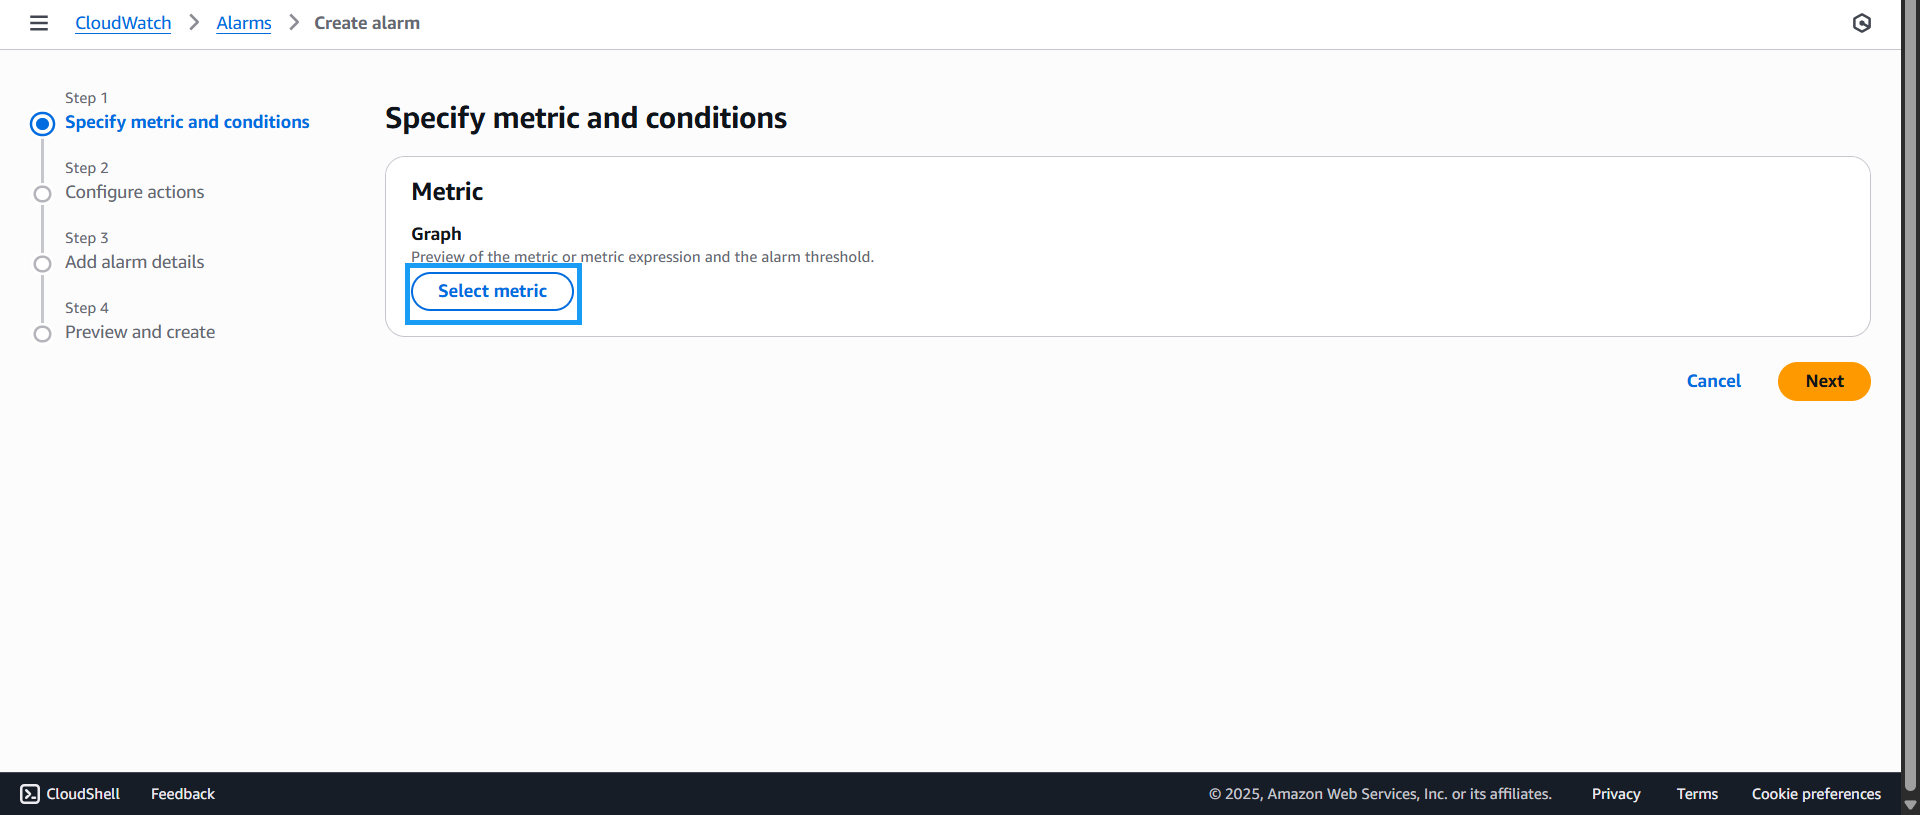
- In Step 1, click Select metric
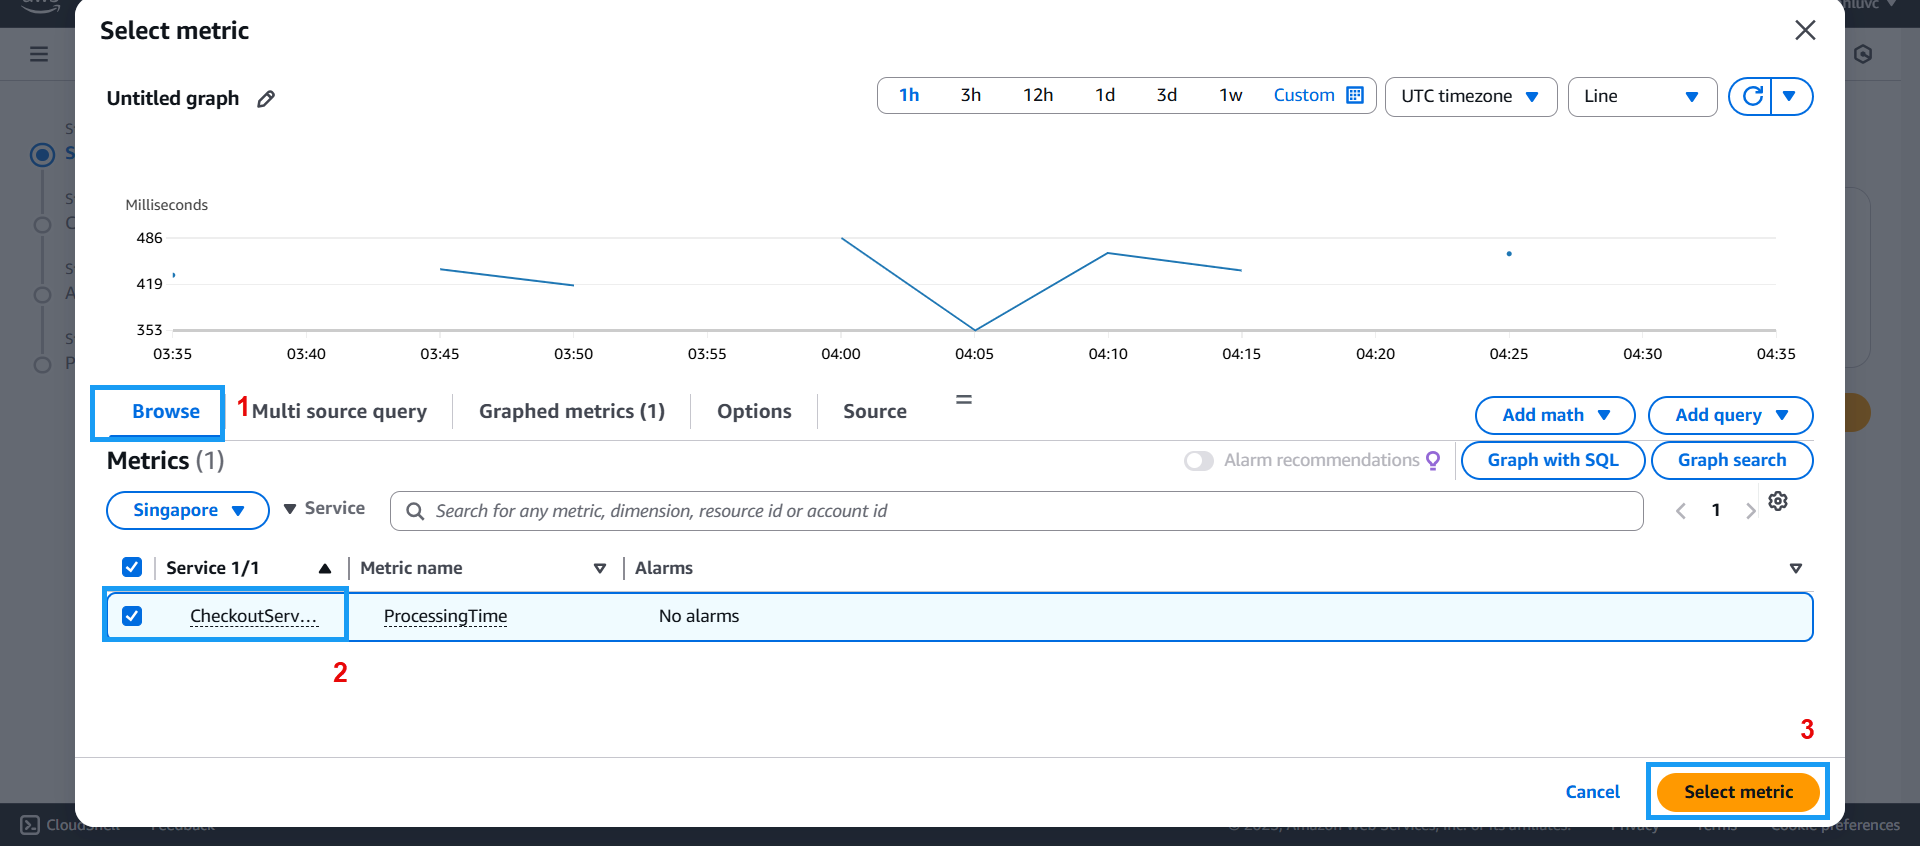
- In the Select metric interface:
- Choose Browse
- Click on the previously created service
- Then click Select metric
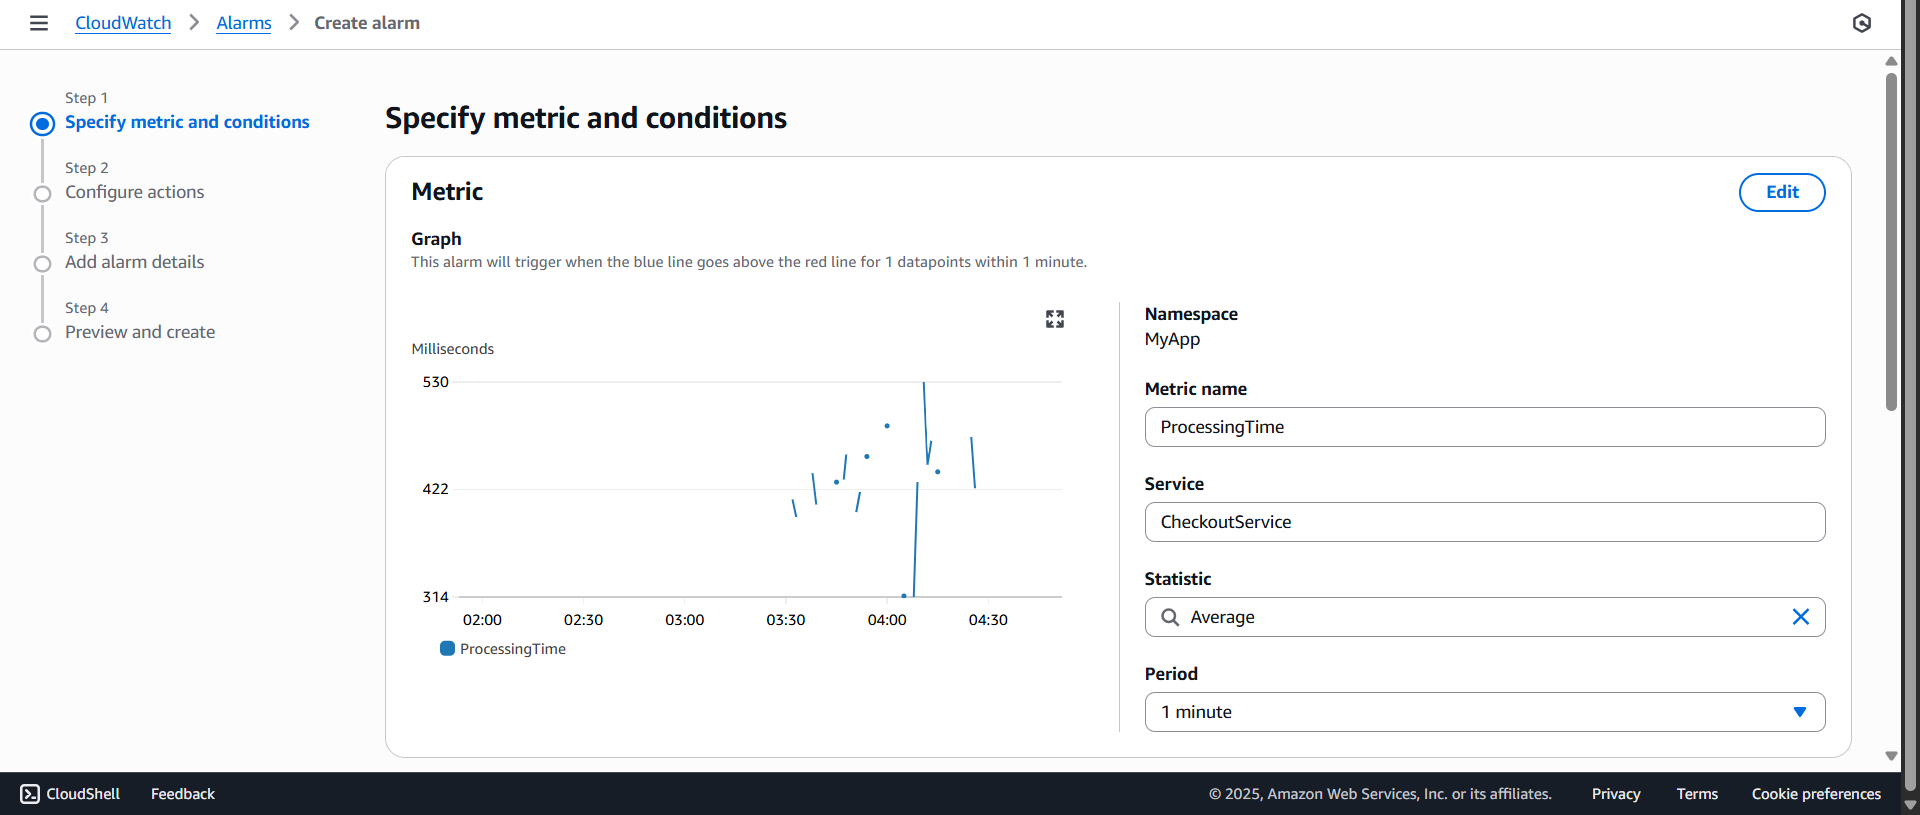
- After selection, your chosen metric will appear along with related details

- Configure the metric settings as shown:
- Scroll down a bit:
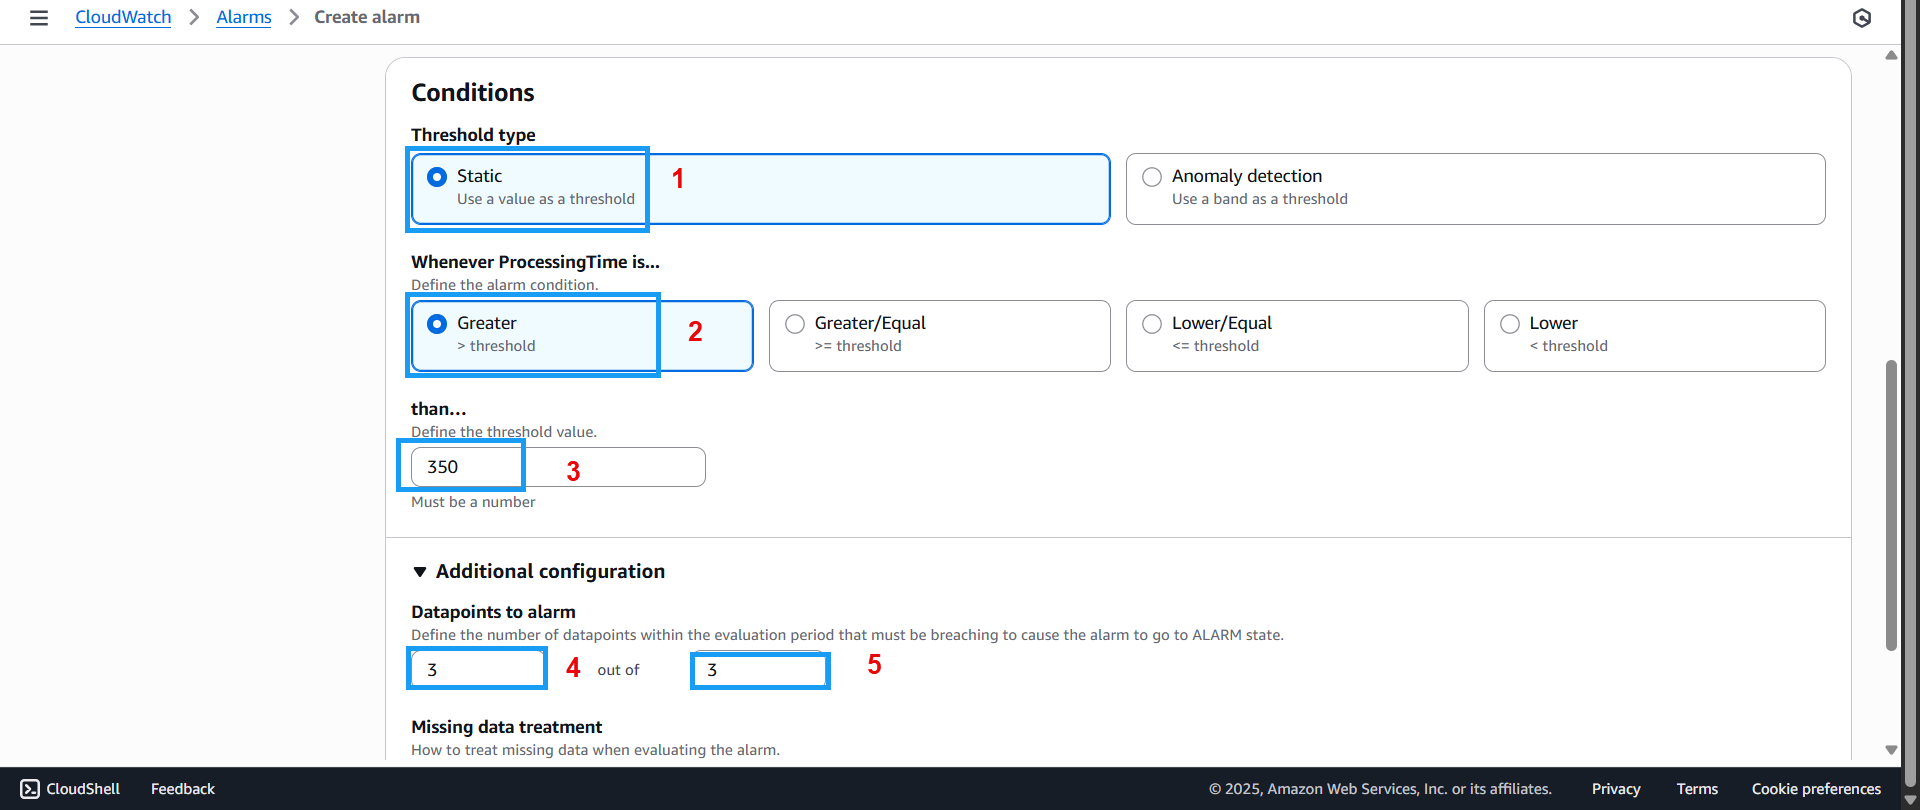
- For Threshold type, select Static
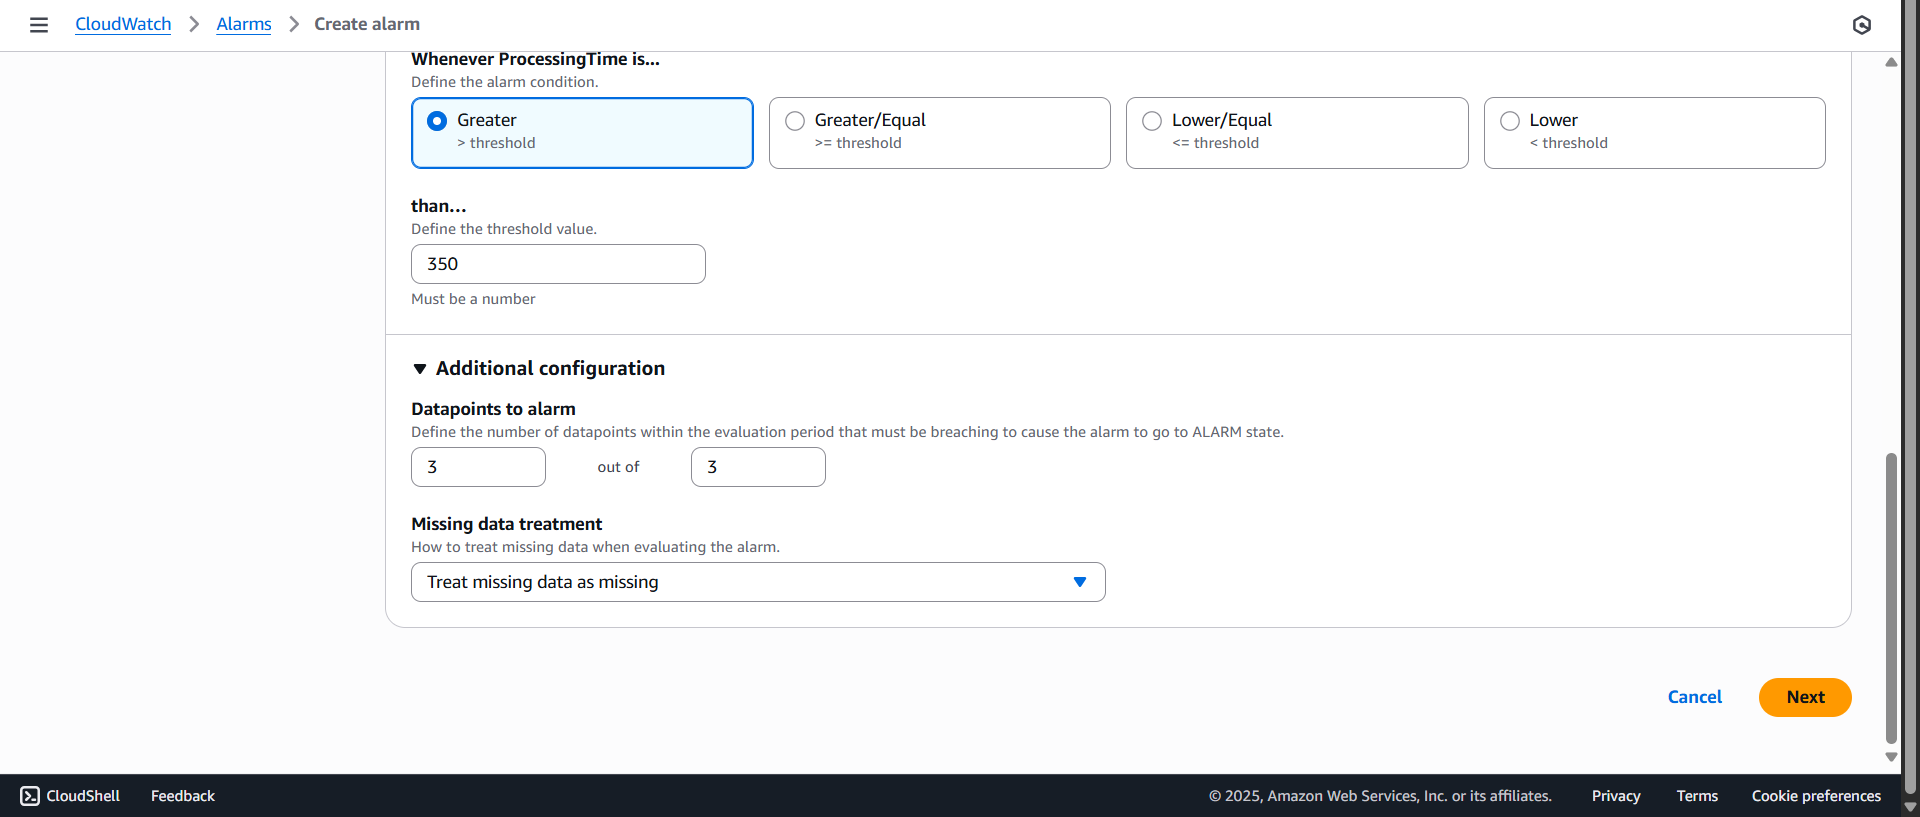
- Under Whenever ProcessingTime is…, choose Greater
- Set the value to 350
- For Datapoints to alarm, set both min and max to 3
- Scroll to the bottom and click Next
- In Step 2 interface:
- Under Alarm state trigger, select In alarm
- Under Send a notification to the following SNS topic, choose Create new topic
- Name the new topic
- Enter your email under Email endpoints that will receive the notification (make sure to confirm when AWS sends the verification email)
- Click Create topic

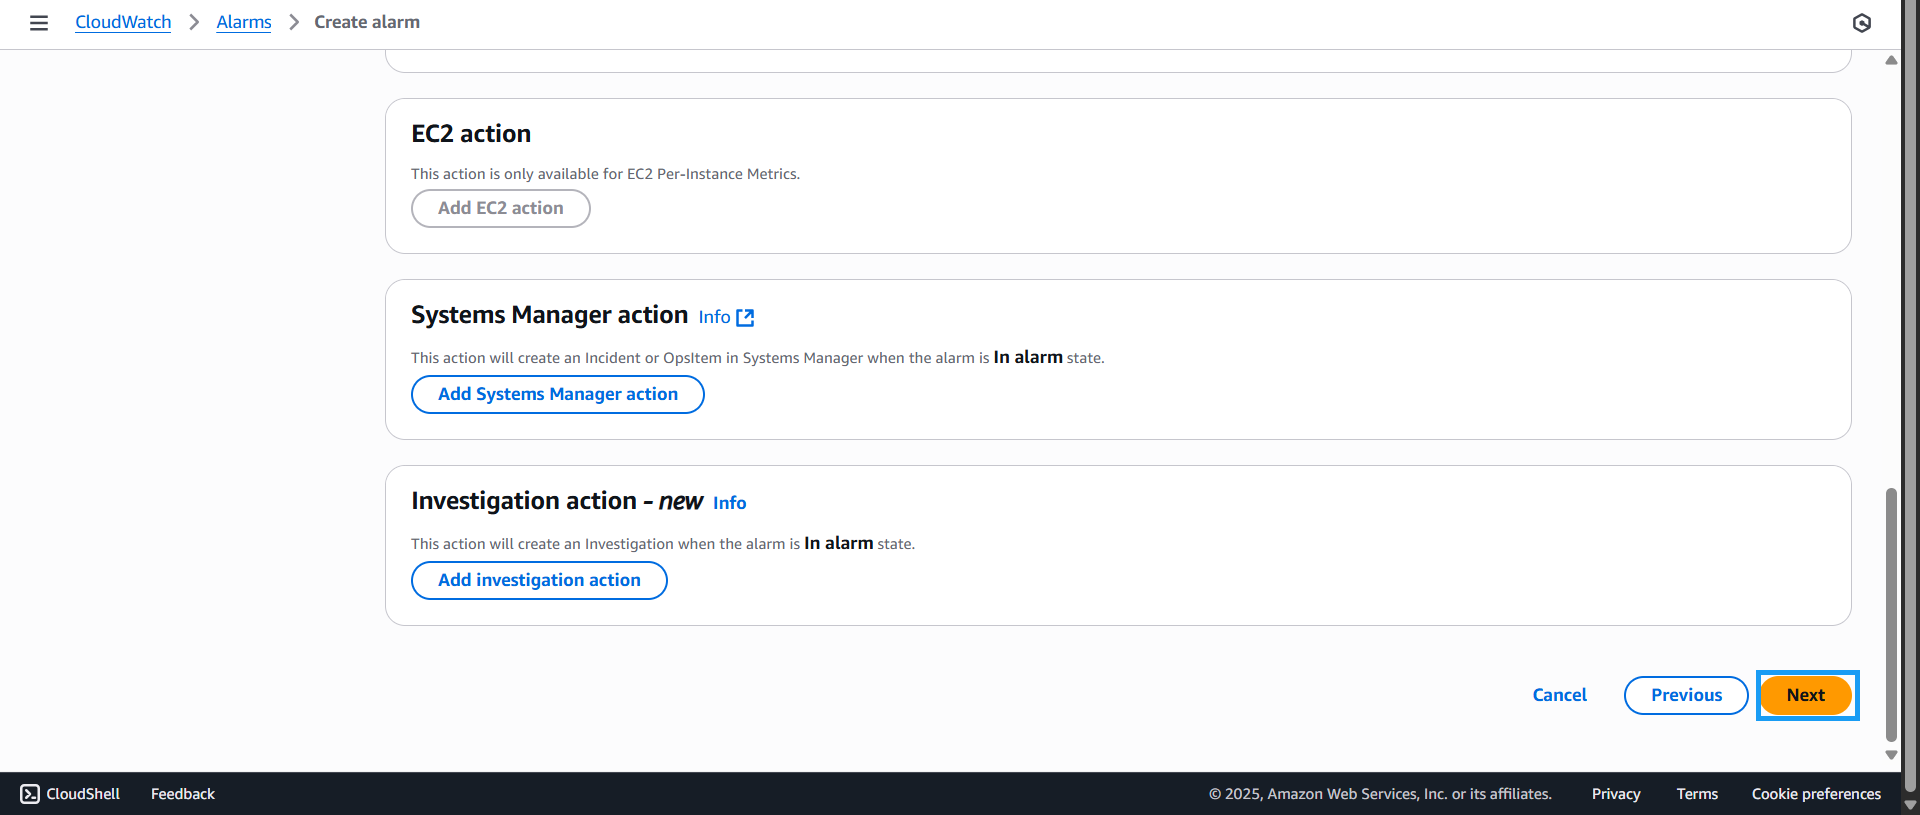
- Scroll down and click Next
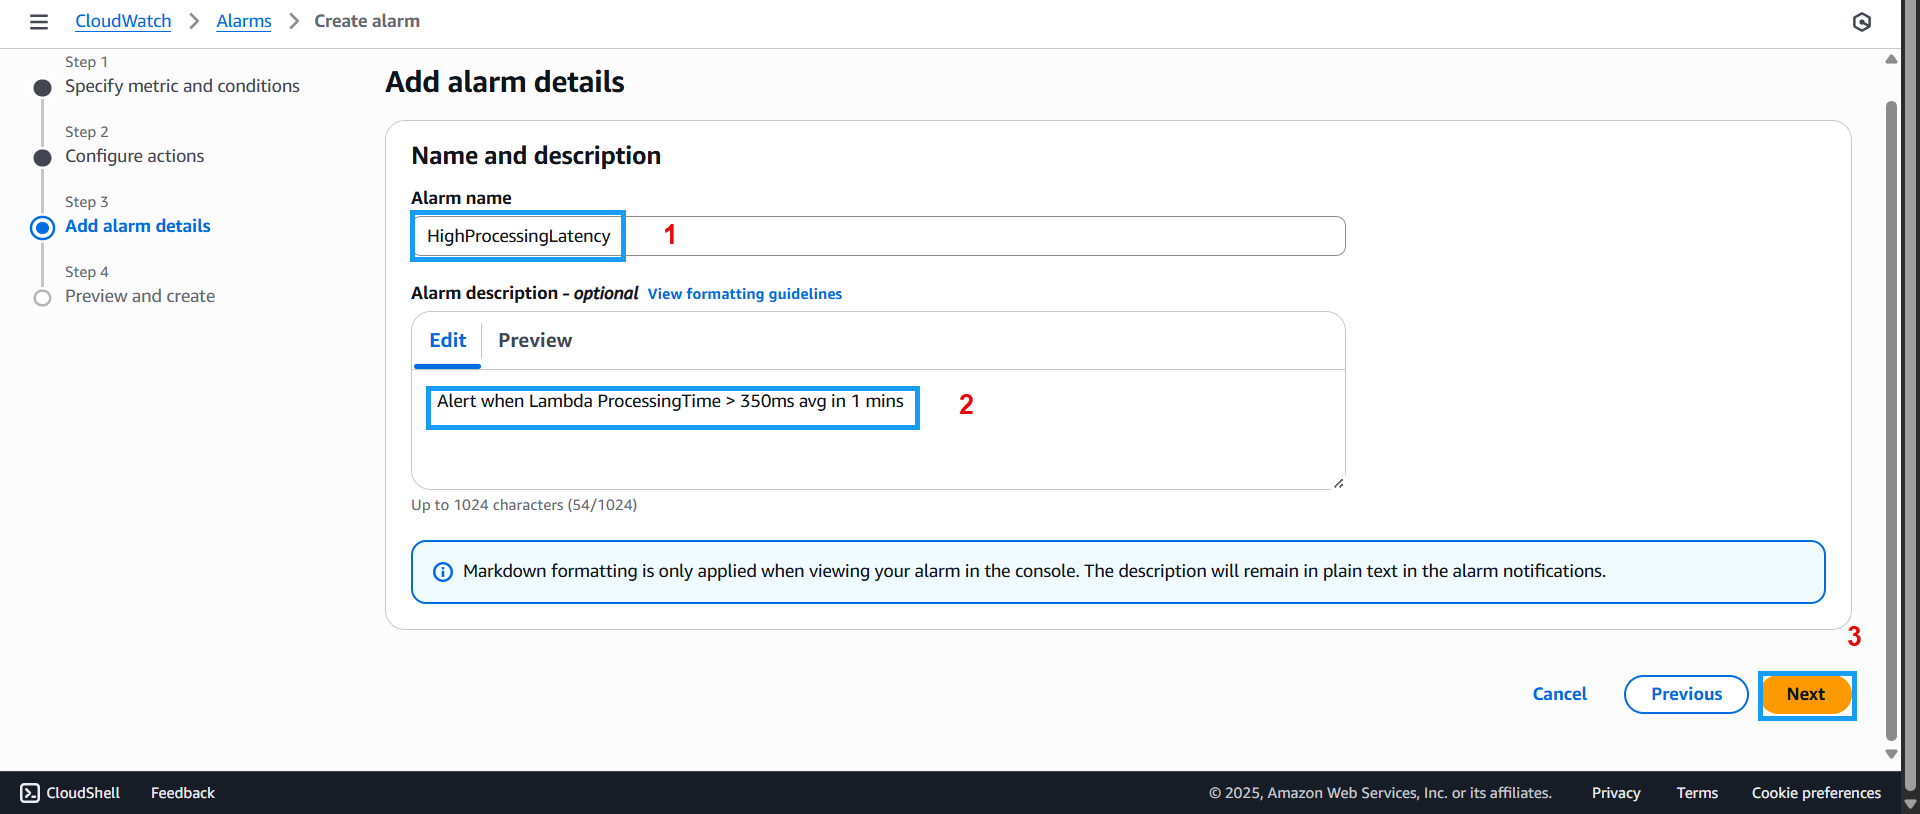
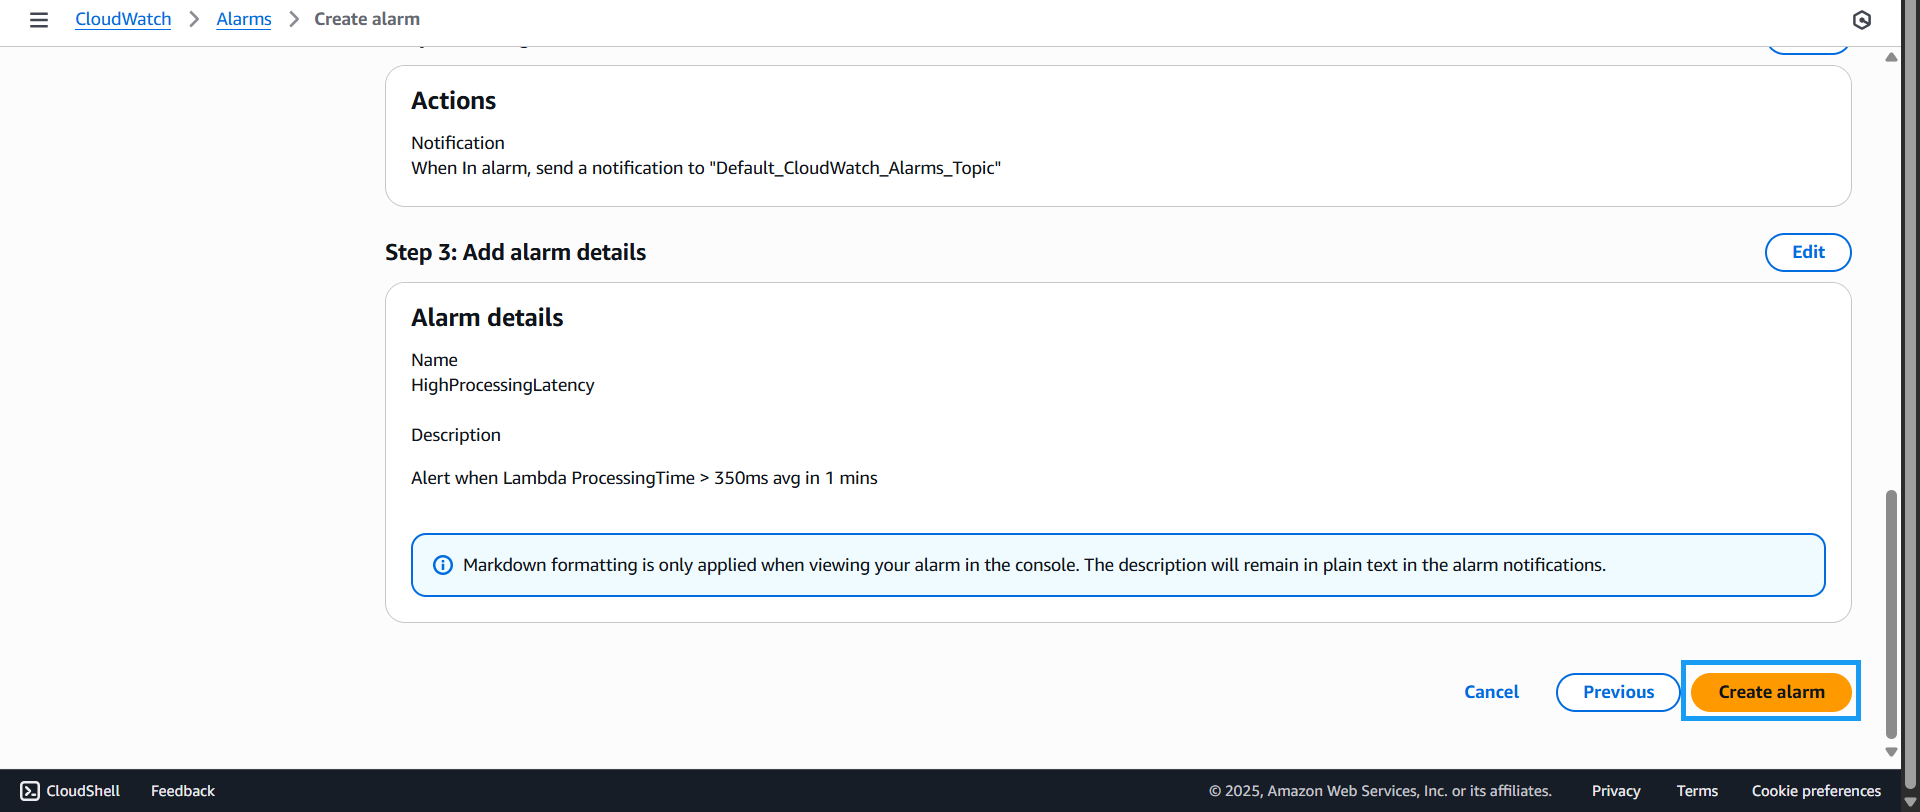
- In Step 3:
- Set Alarm name to
HighProcessingLatency - In Description, enter:
Alert when Lambda ProcessingTime > 350ms avg in 1 min - Click Next
- The Overview screen will appear. Review your settings and click Create alarm
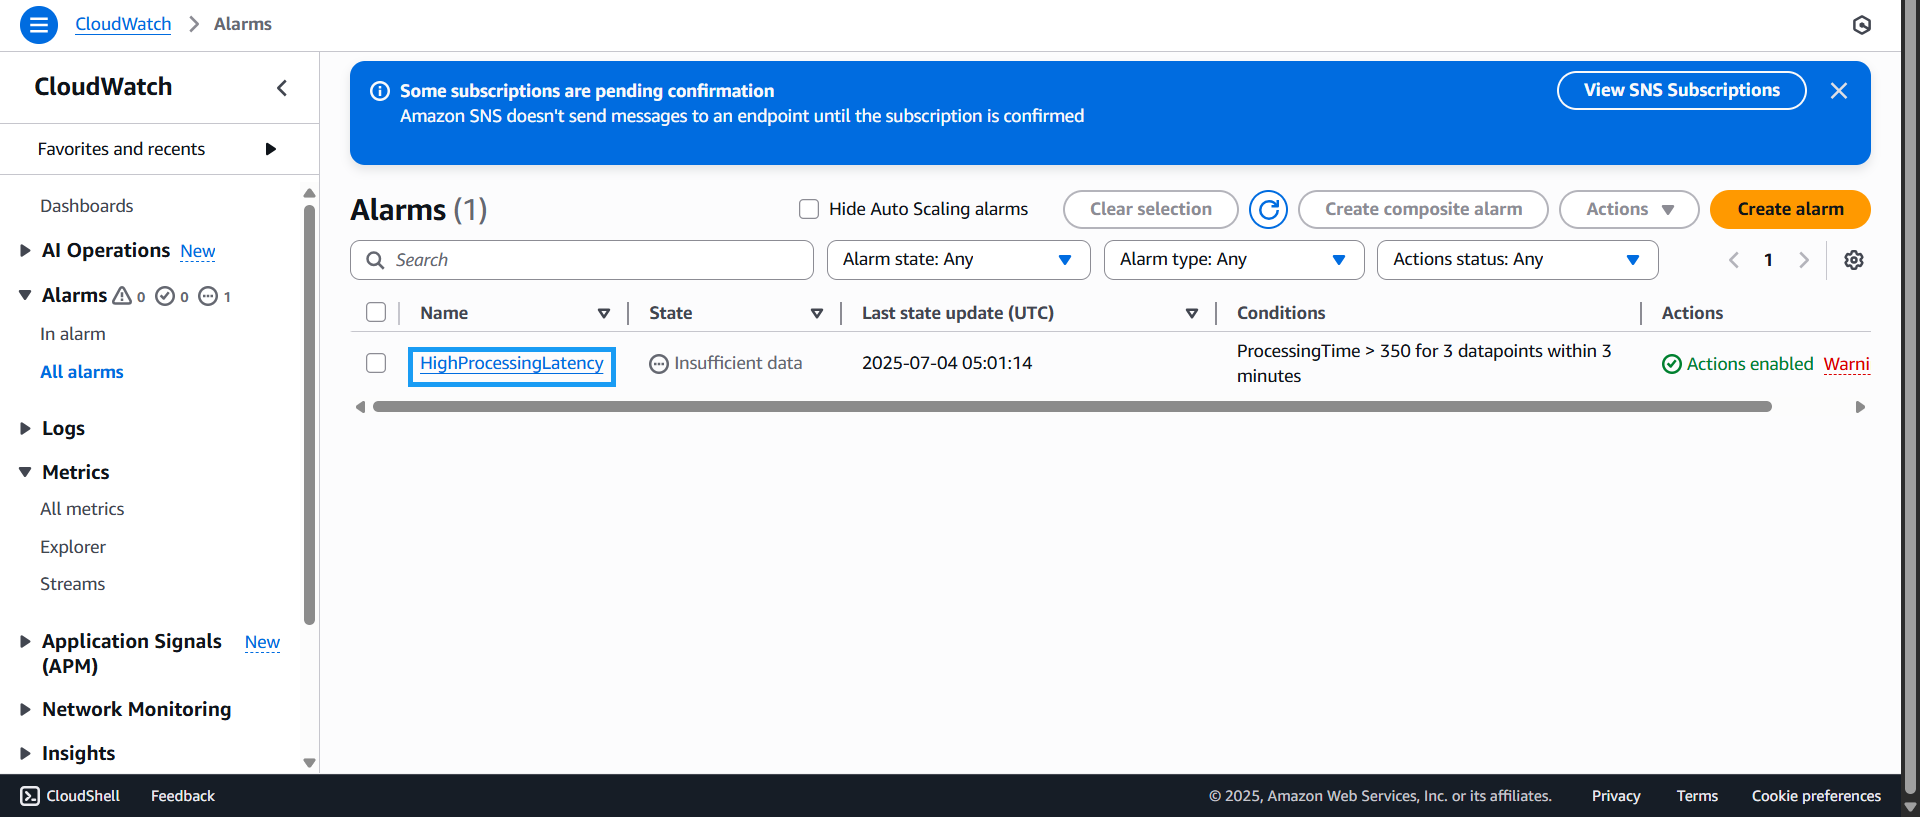
- You will be redirected to the Alarms Management screen — click on the alarm you just created
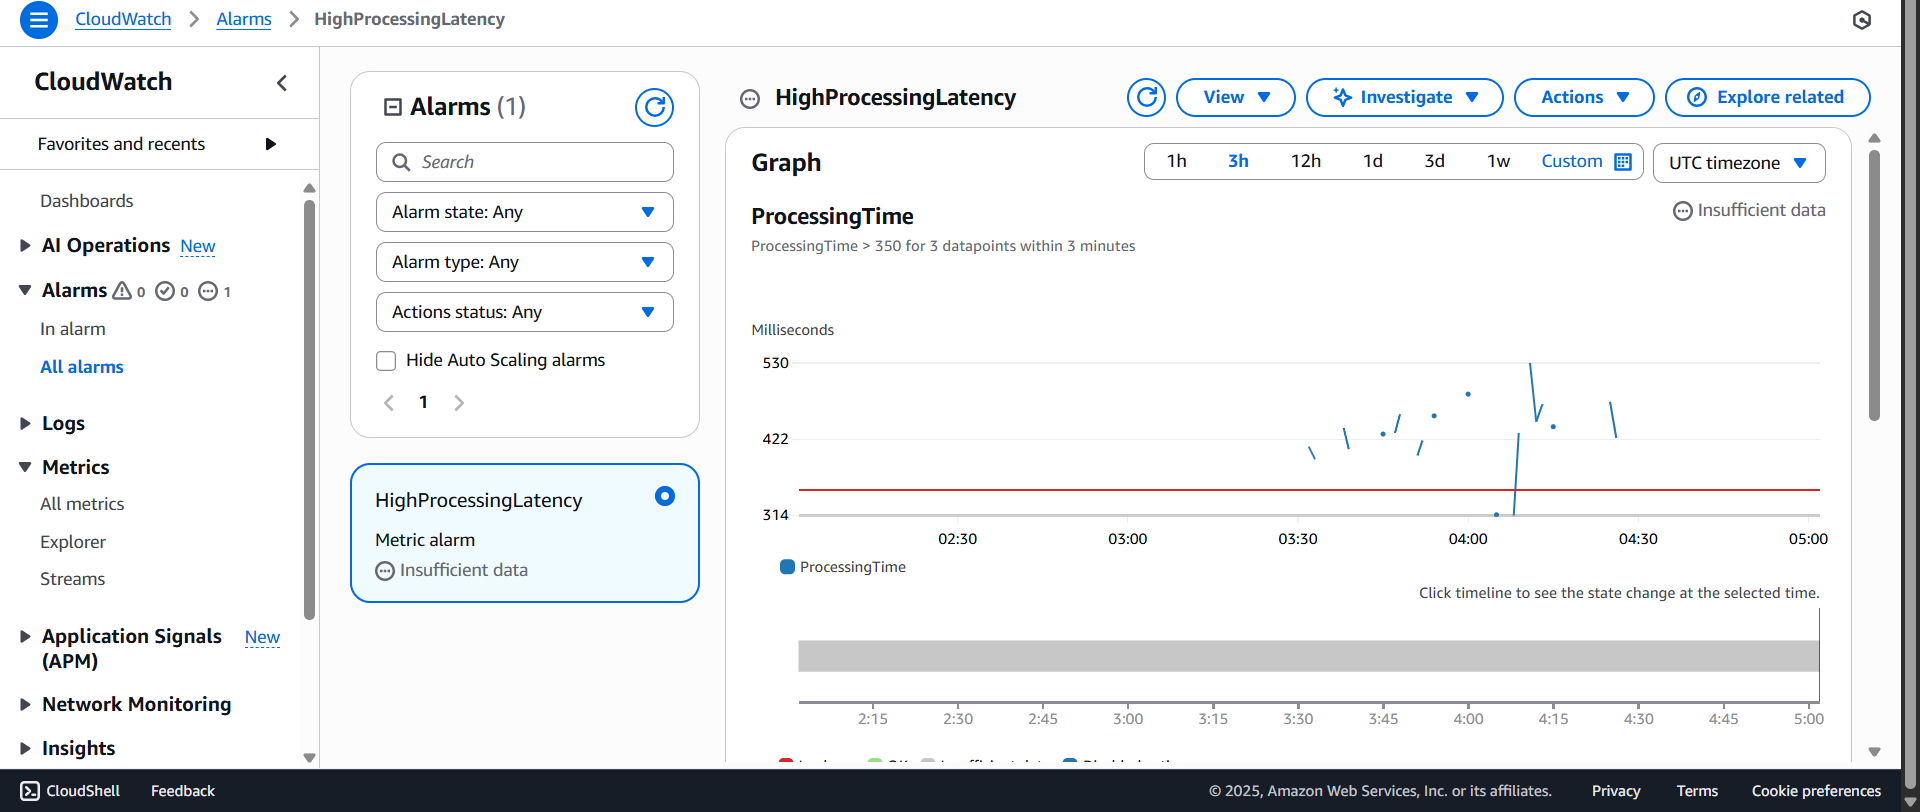
- Review the alarm details and important configuration metrics
- Use Postman to send a high volume of test requests

- Go back to the Alarms page and check the alarm status and metrics

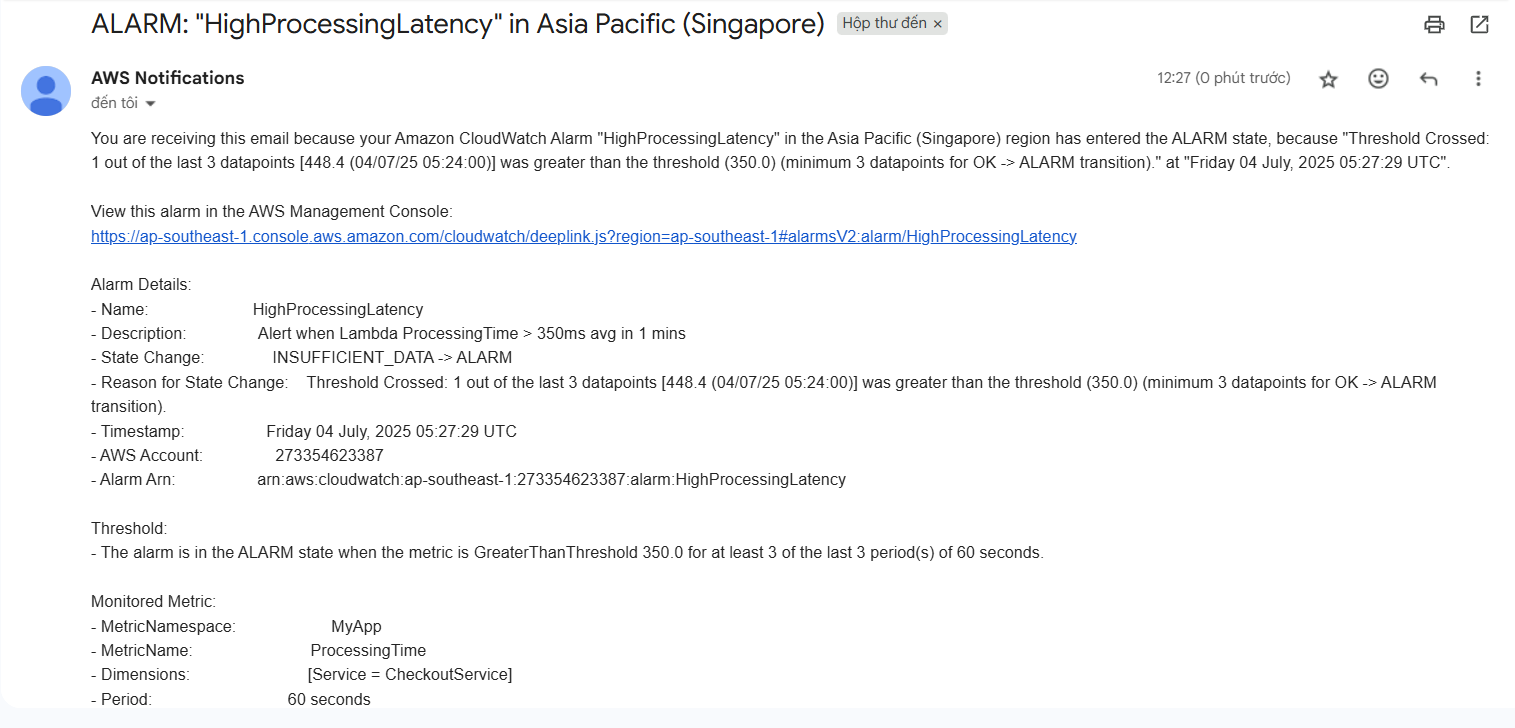
- Wait for an alert email from AWS
And that’s it — we’ve successfully created an alert system. In the next section, we’ll explore cost analysis and system optimization.