Create a Dashboard
In this step, we will create a monitoring dashboard, allowing us to observe key metrics at the time of creation.
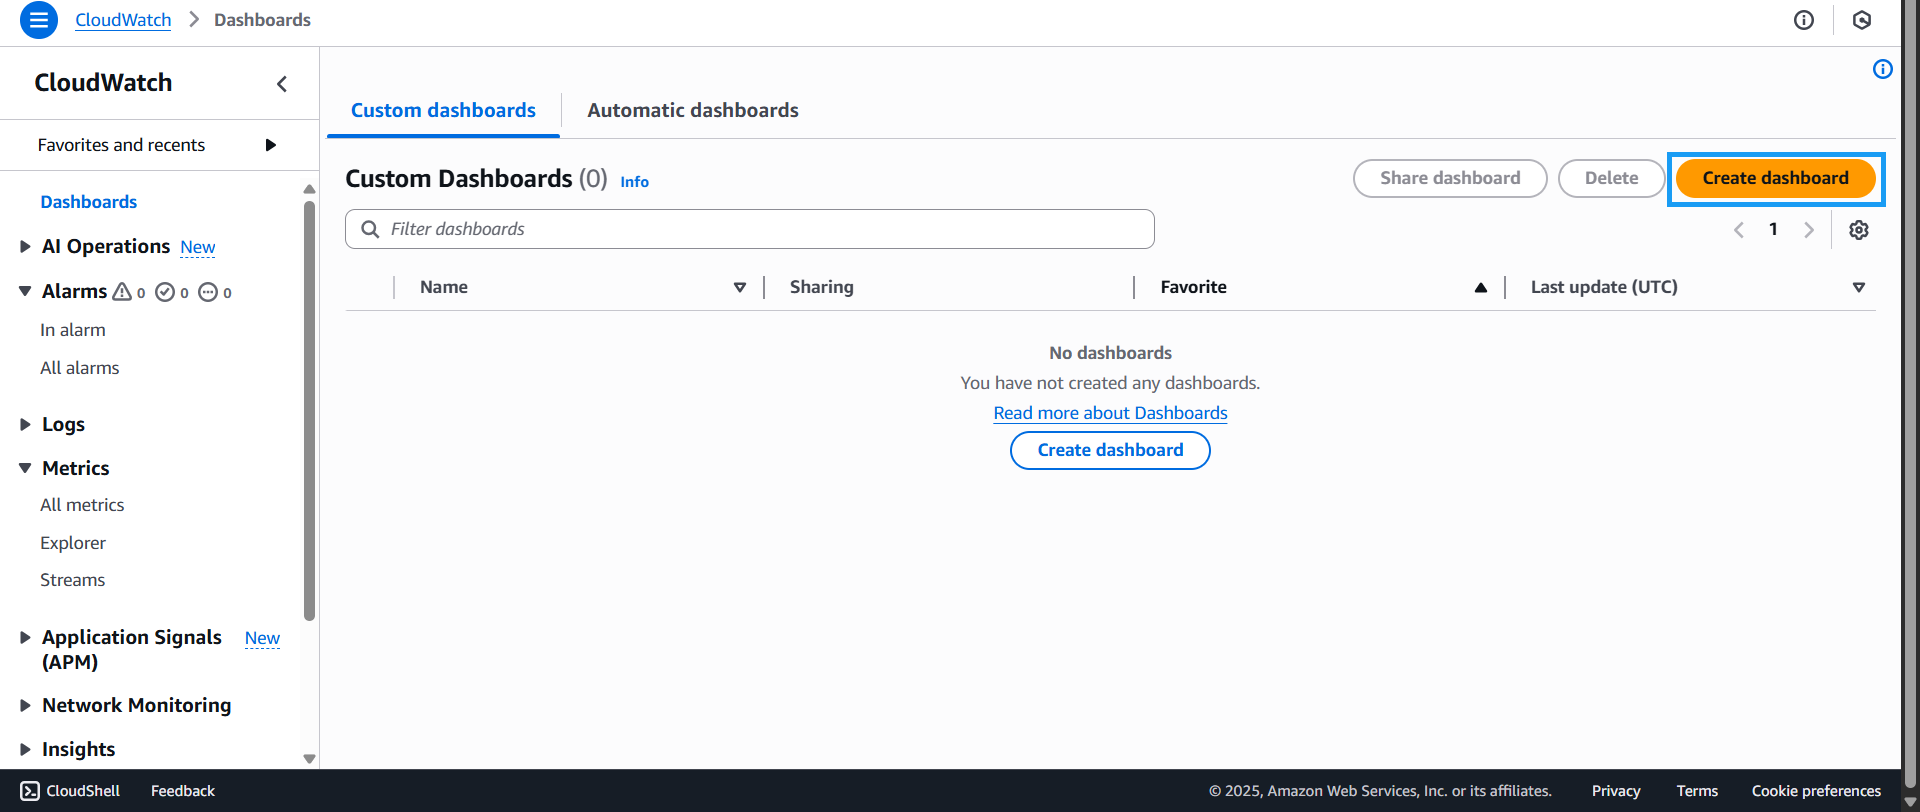
- Go to the CloudWatch Console
- Click on Dashboards
- Click on Create dashboard
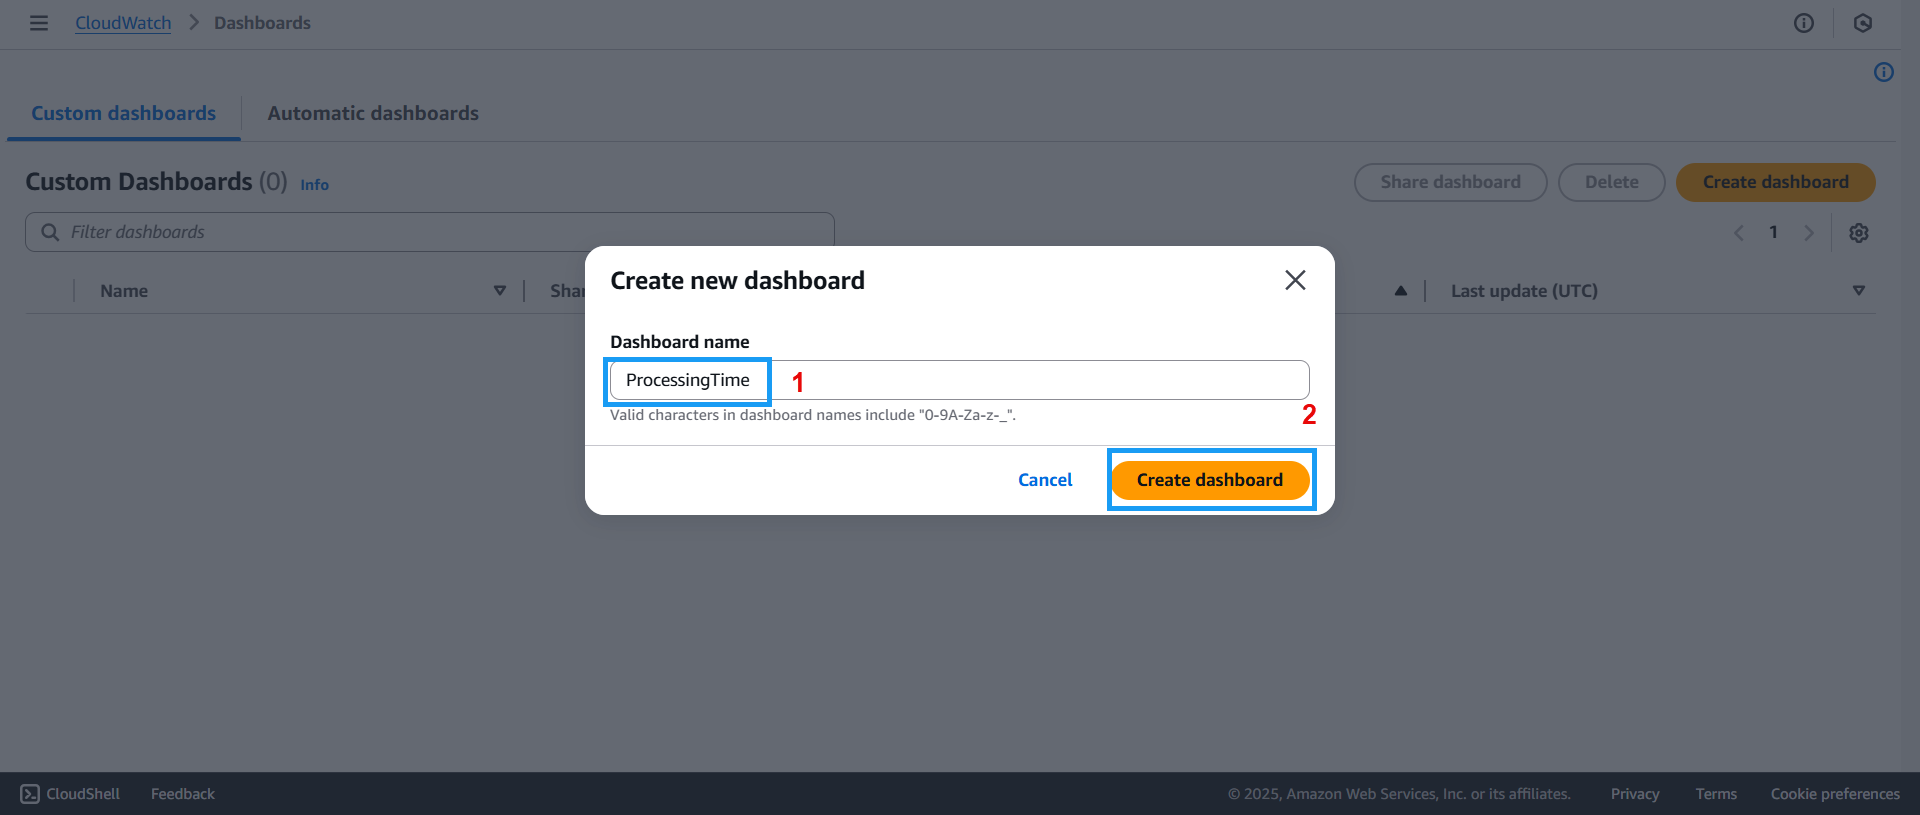
- The Create new dashboard screen will appear:
- Enter the dashboard name: ProcessingTime
- Click Create dashboard
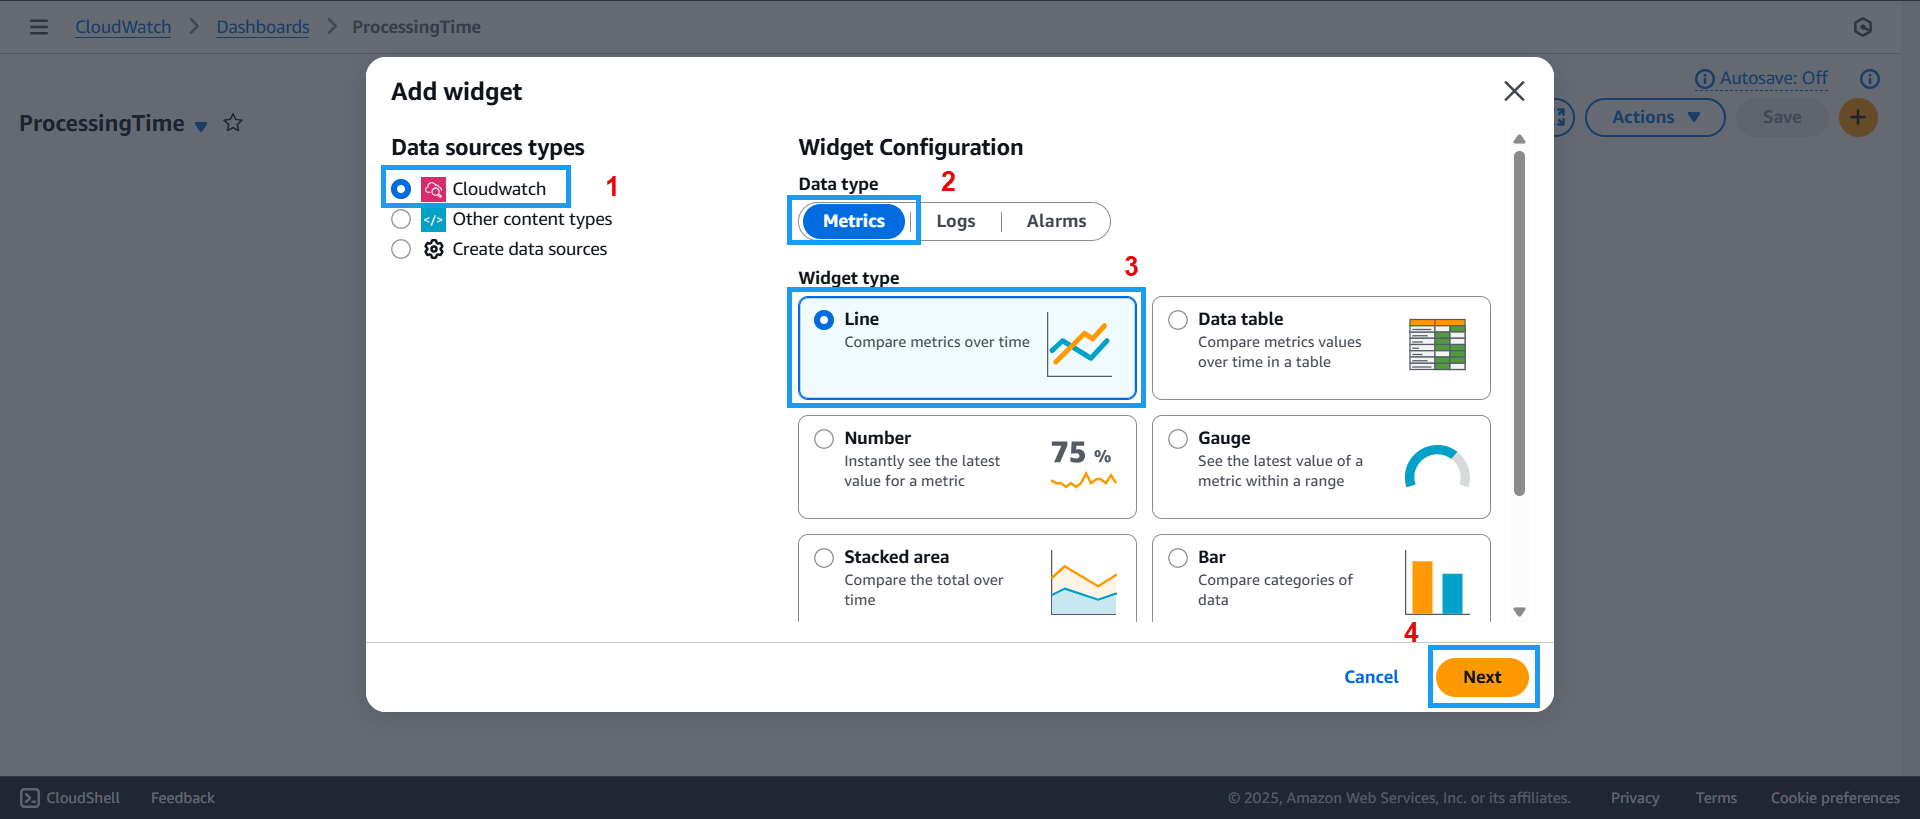
- The Add widget screen will appear:
- For Data source type, select CloudWatch
- For Data type, select Metrics
- For Widget type, choose Line
- Click Next
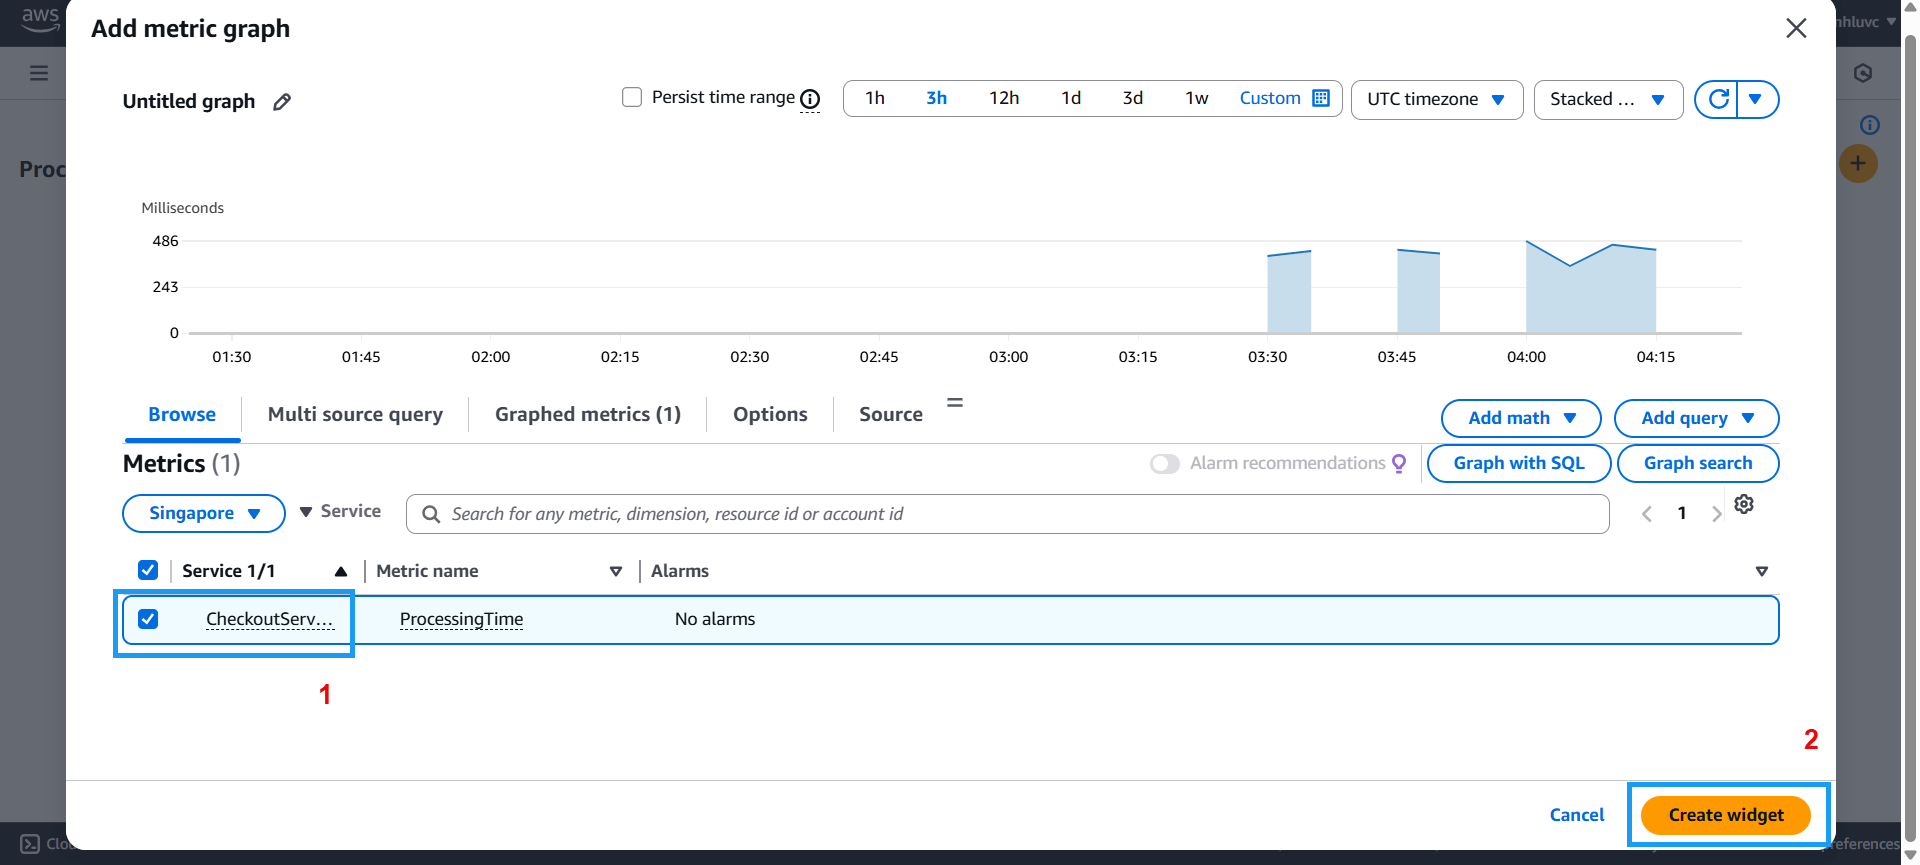
- The Add metric graph dialog will appear:
- Select your desired service as shown
- Click Create widget
- Once the dashboard is created, return to the dashboard management page to view the dashboards you’ve created:
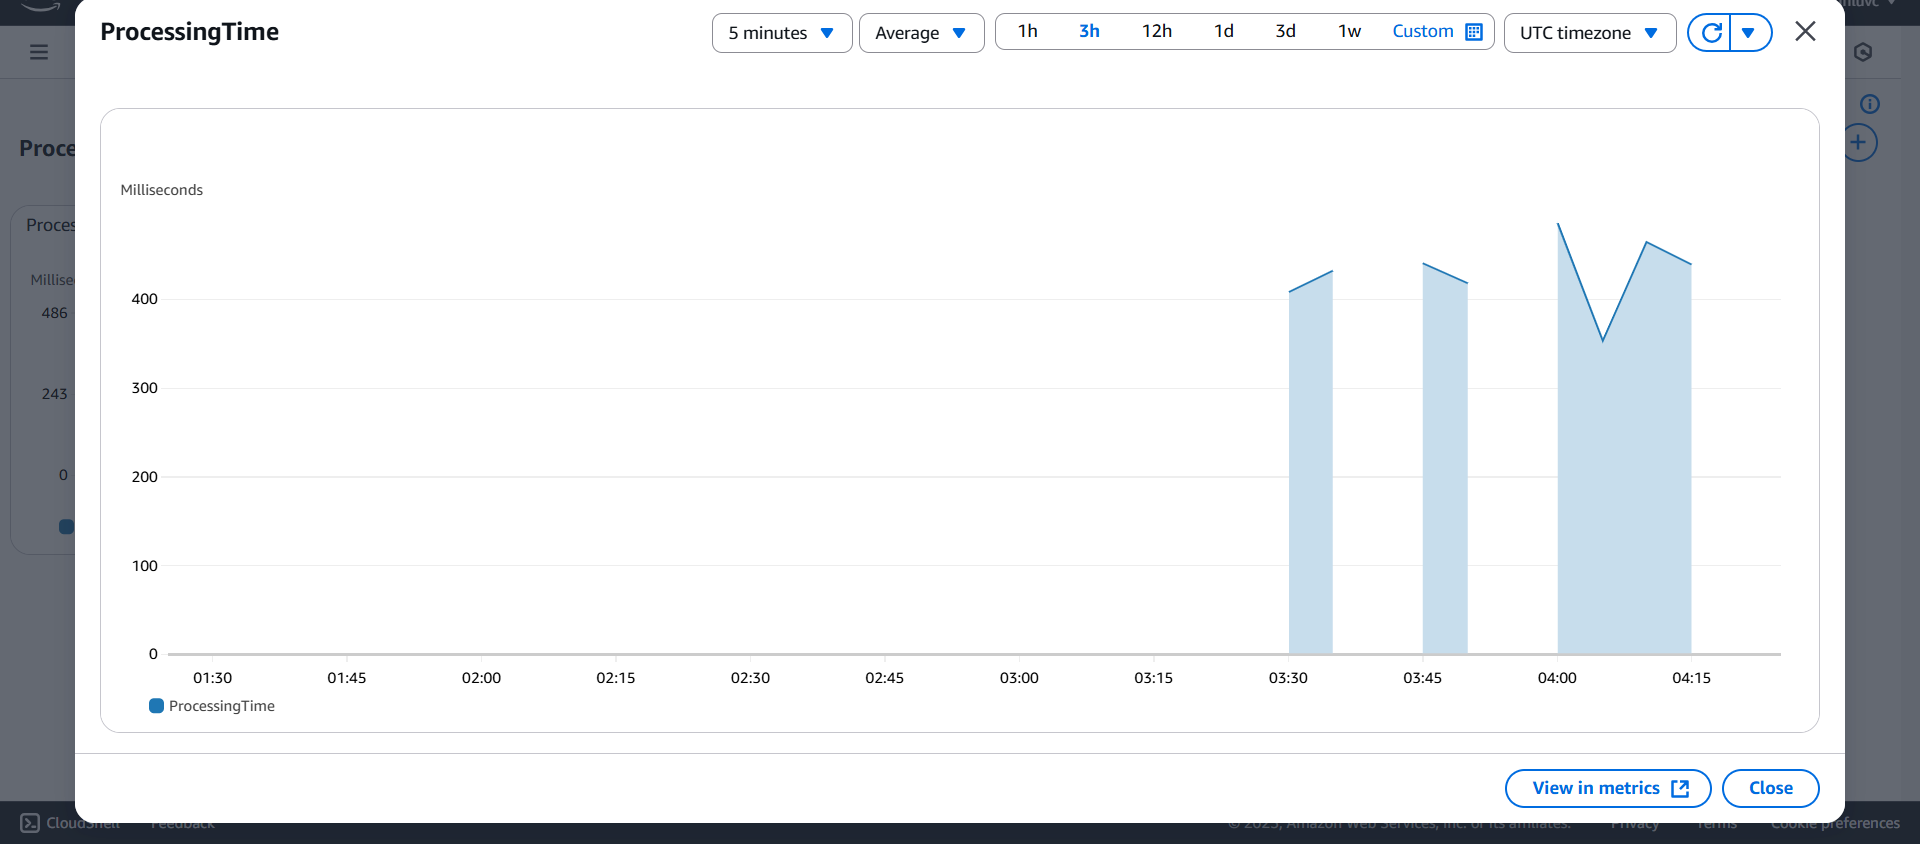
That’s it! You’ve created a dashboard to monitor key metrics. Next, we’ll move on to setting up an alert system.