Monitoring Performance with CloudWatch Custom Metrics
In this section, we will monitor the application’s performance using CloudWatch Custom Metrics. You’ll view custom metric details and visualize the ProcessingTime as a line chart, among others.
- Go to the CloudWatch Console
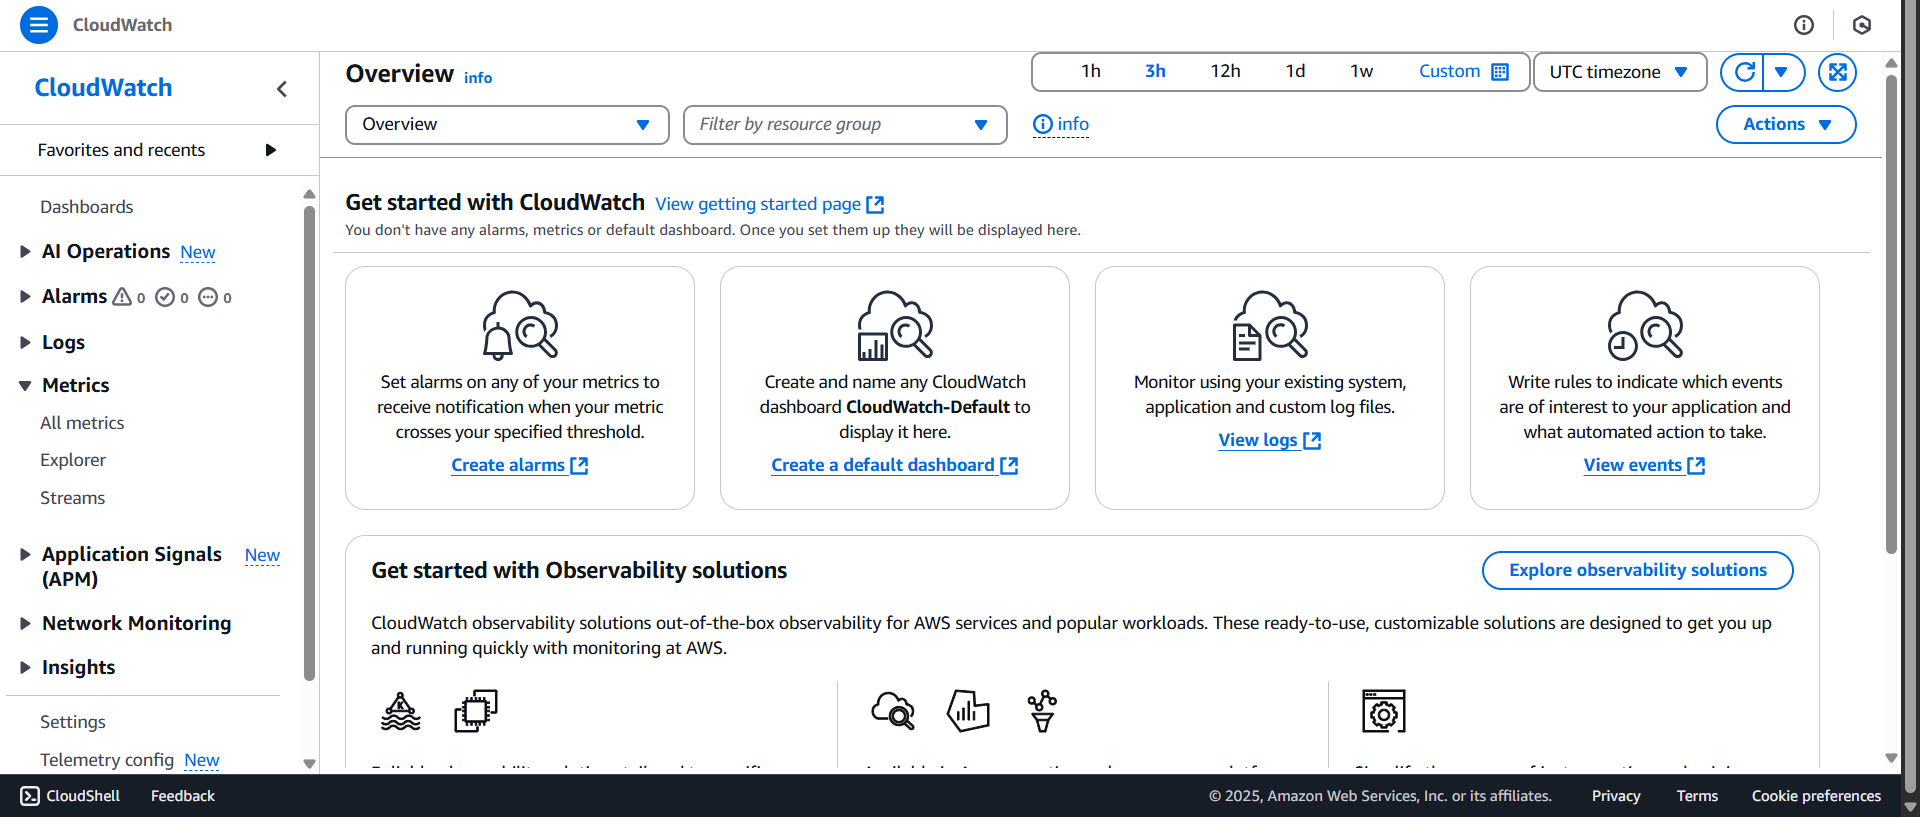
- Under the Metrics section:
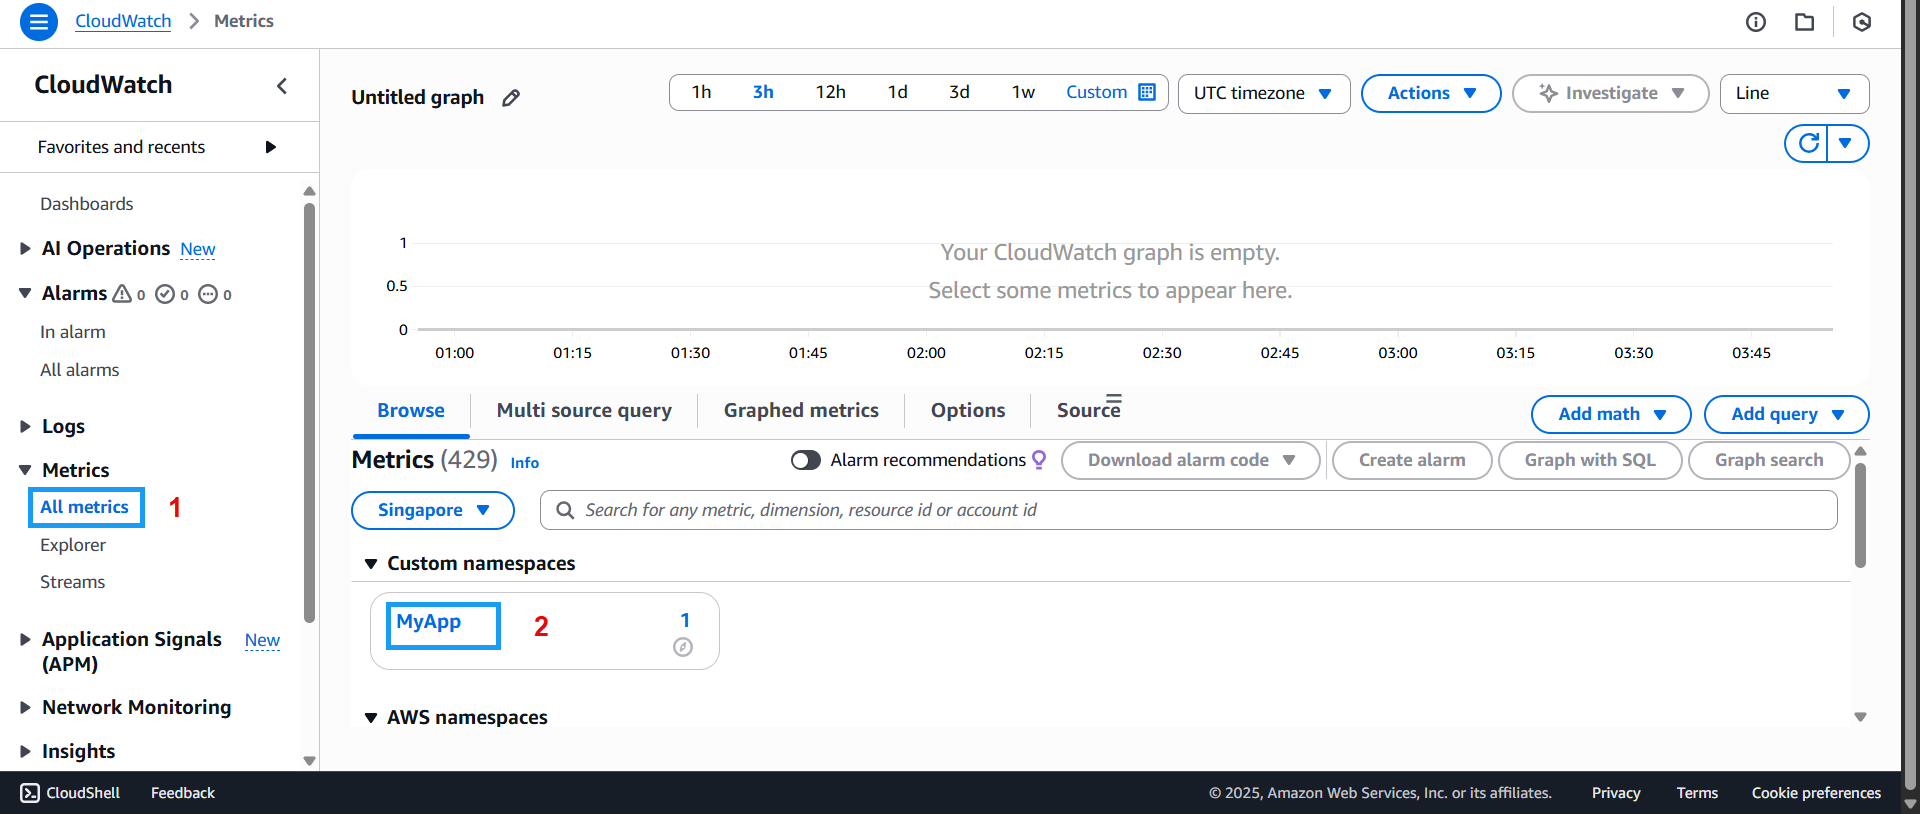
- Click on All metrics
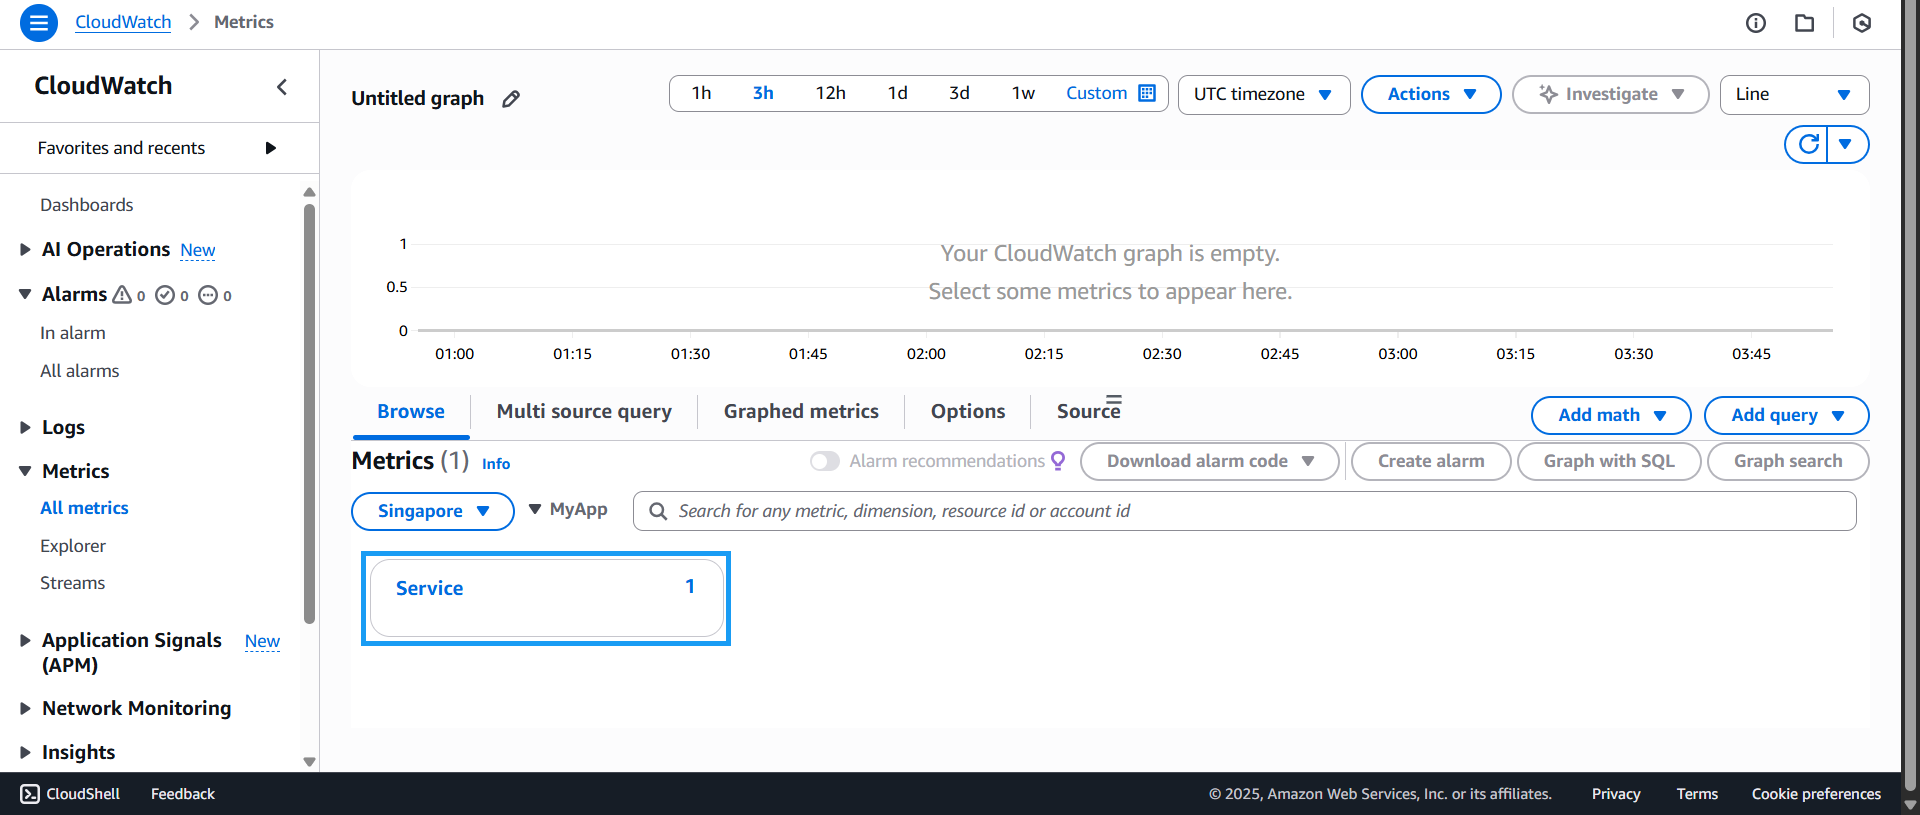
- Then click on MyApp
- Next, click on Service
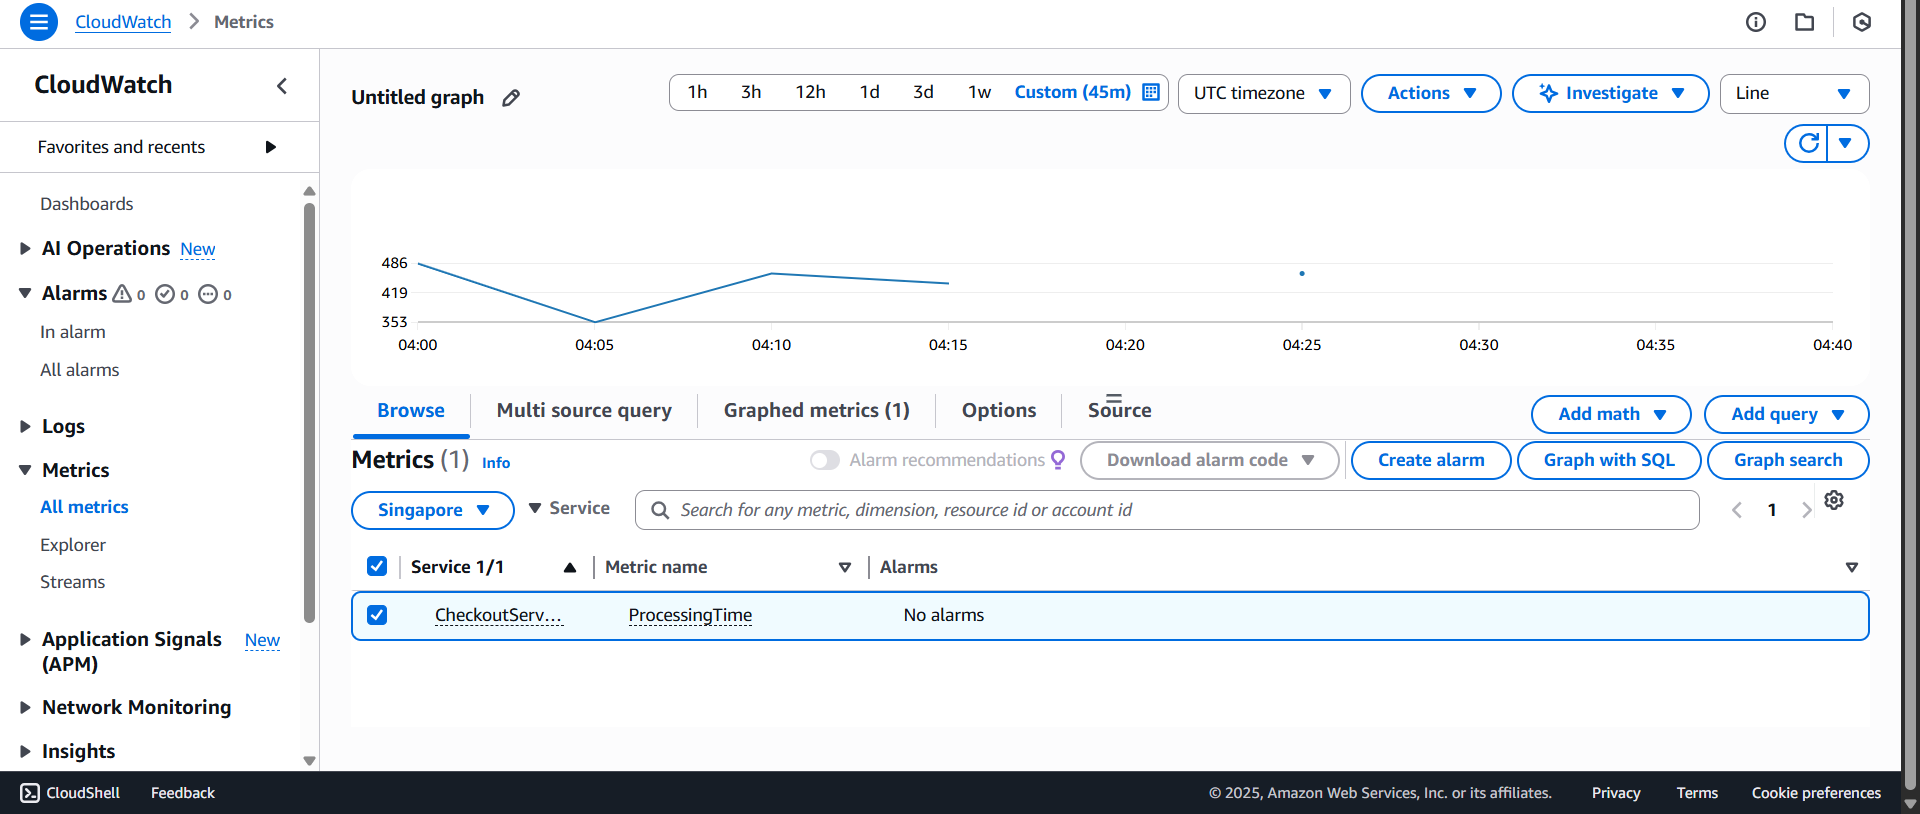
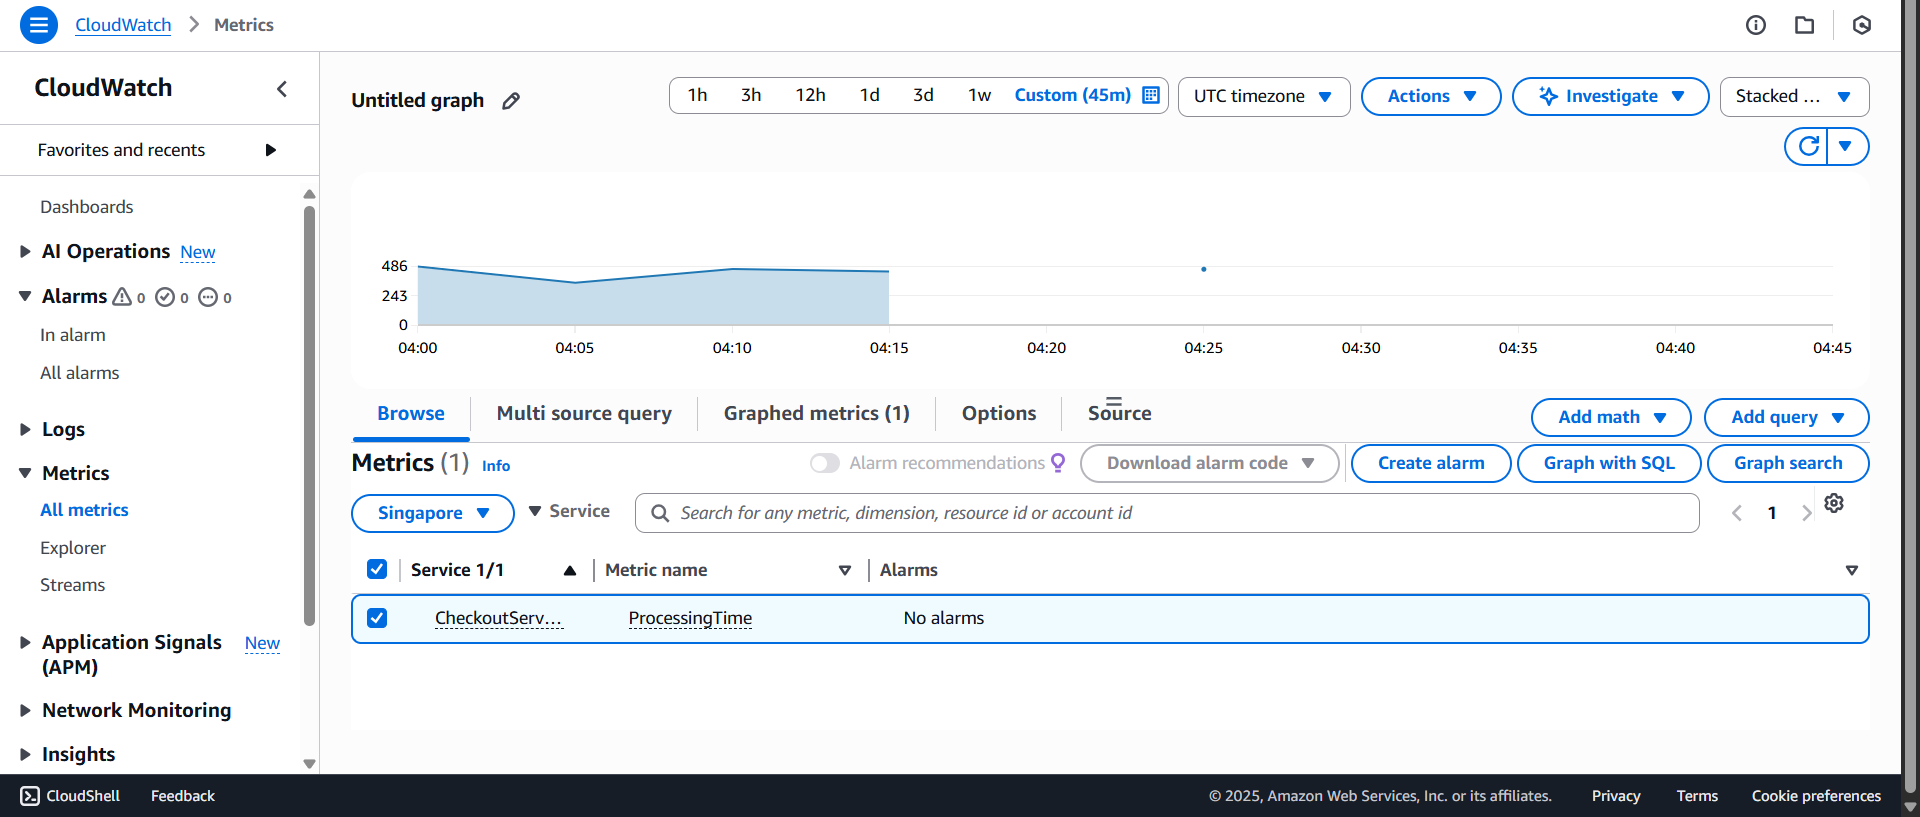
- Then select CheckoutService and choose the Line chart type

- The line chart of the custom metric will appear. Here, you can observe fluctuations in processing time over time. You can adjust the time range as needed. This helps identify periods where performance is suboptimal and allows you to prepare remediation strategies.
You can also explore other chart types, such as the Stacked area chart:
That concludes the section on Monitoring Performance with CloudWatch Custom Metrics. The insights from this part should give you a clearer picture of how Custom Metrics work. Through the data and visualizations, you’ll be better equipped for the next steps.