Analyzing and Inspecting with AWS X-Ray
Analyzing and Inspecting with AWS X-Ray
In this step, we will analyze and inspect the serverless application using AWS X-Ray. From important metrics — especially latency — we can derive optimization strategies to improve performance.
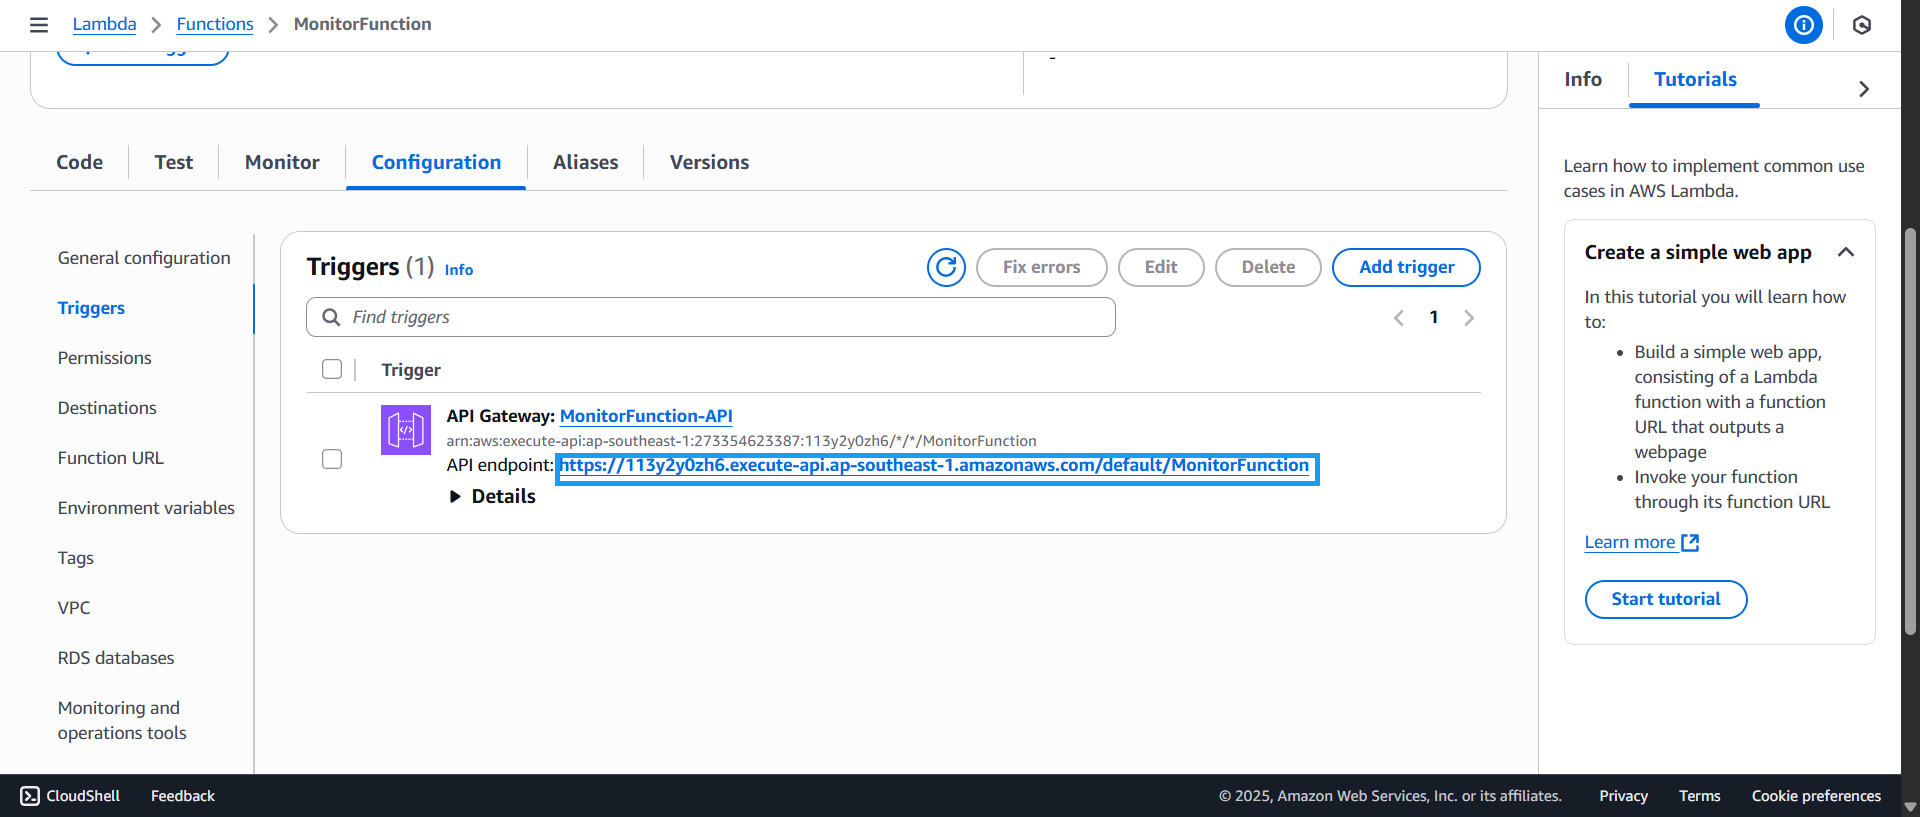
- Access the previously created trigger and copy the API endpoint:
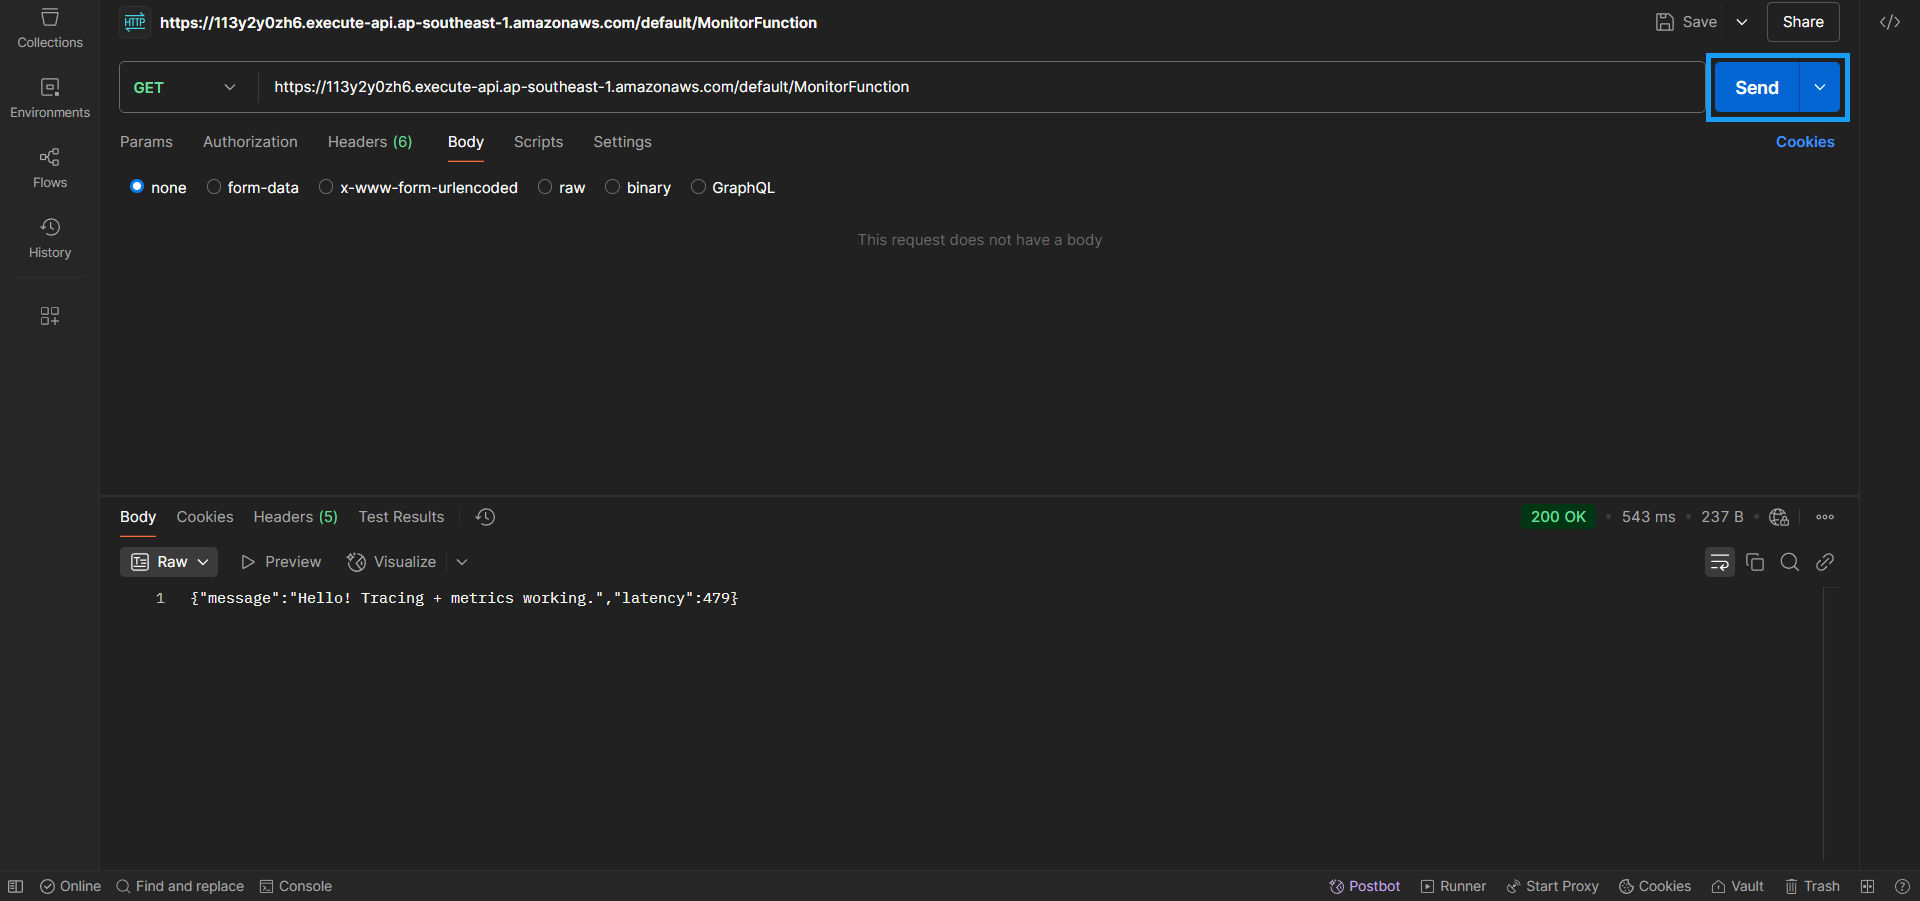
- Use Postman to test the API endpoint (send about 5 to 7 requests):
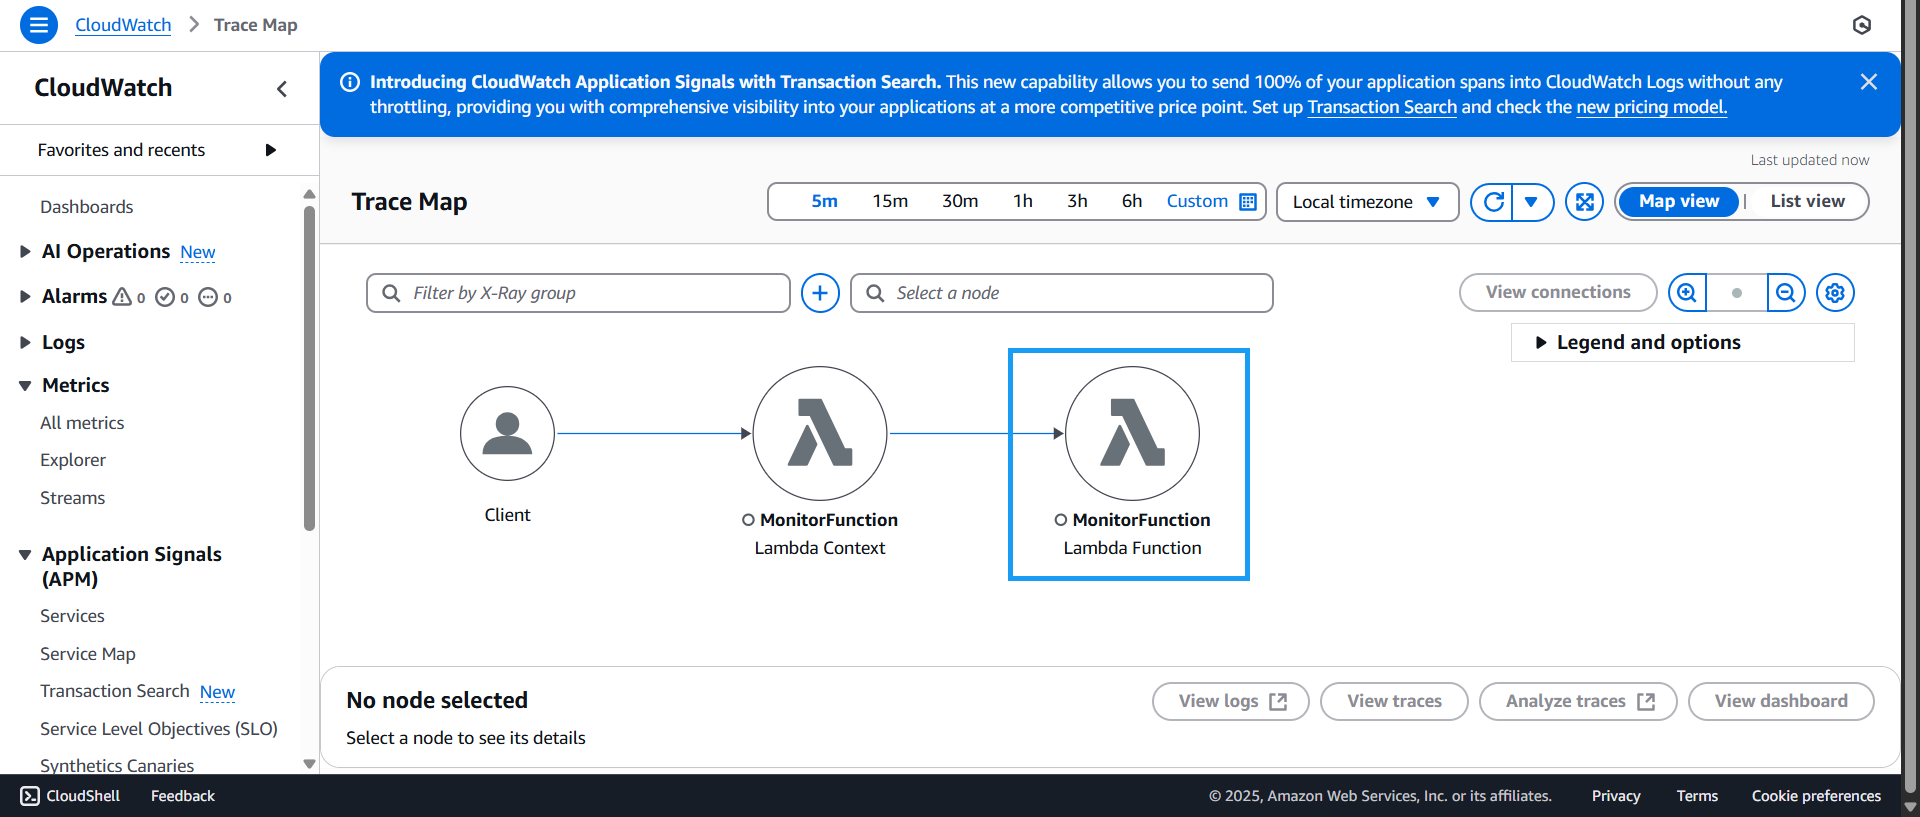
- Go to the Trace Map Console
- Observe the diagram with 3 main components: Client, Lambda Context, and Lambda Function
- Click on Lambda Function
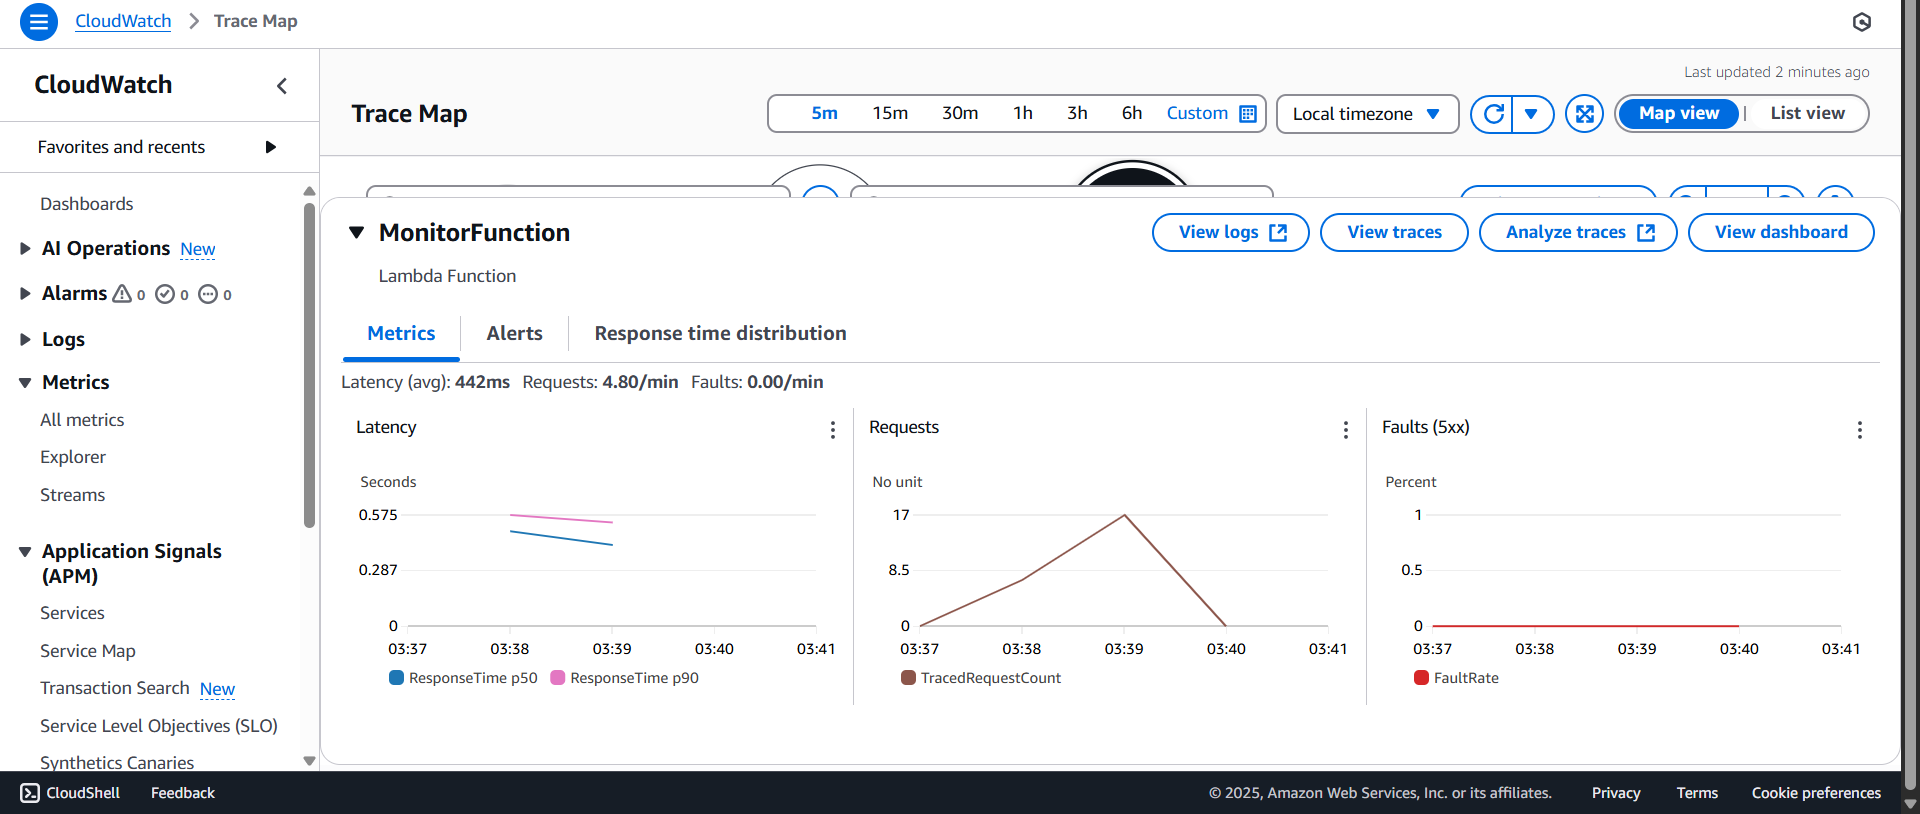
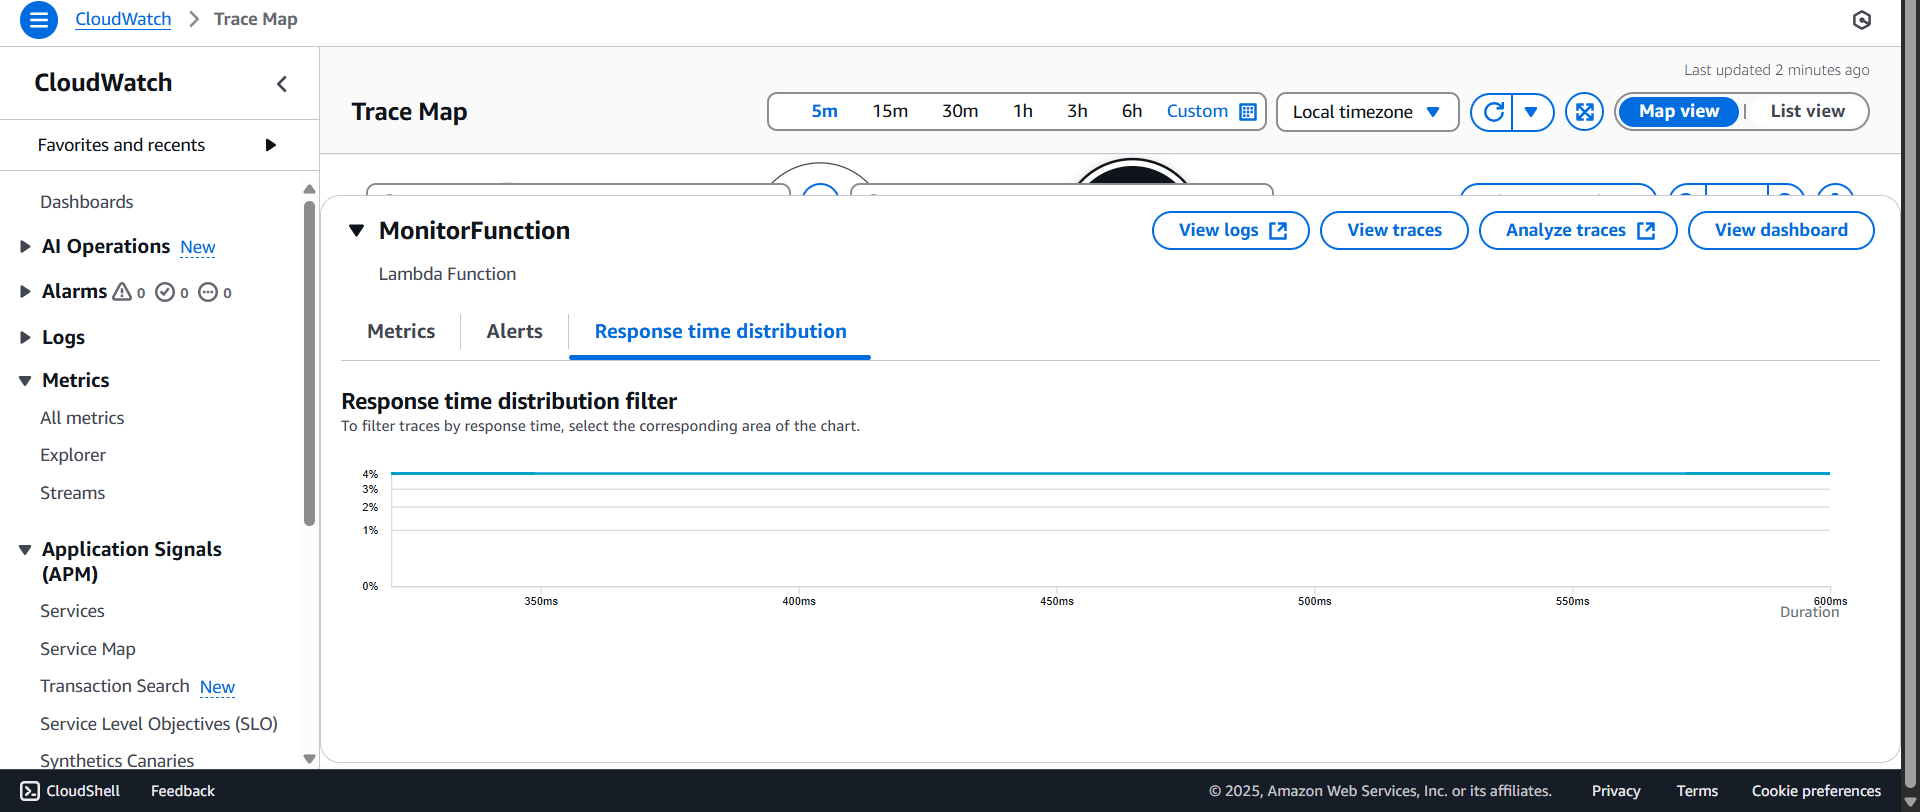
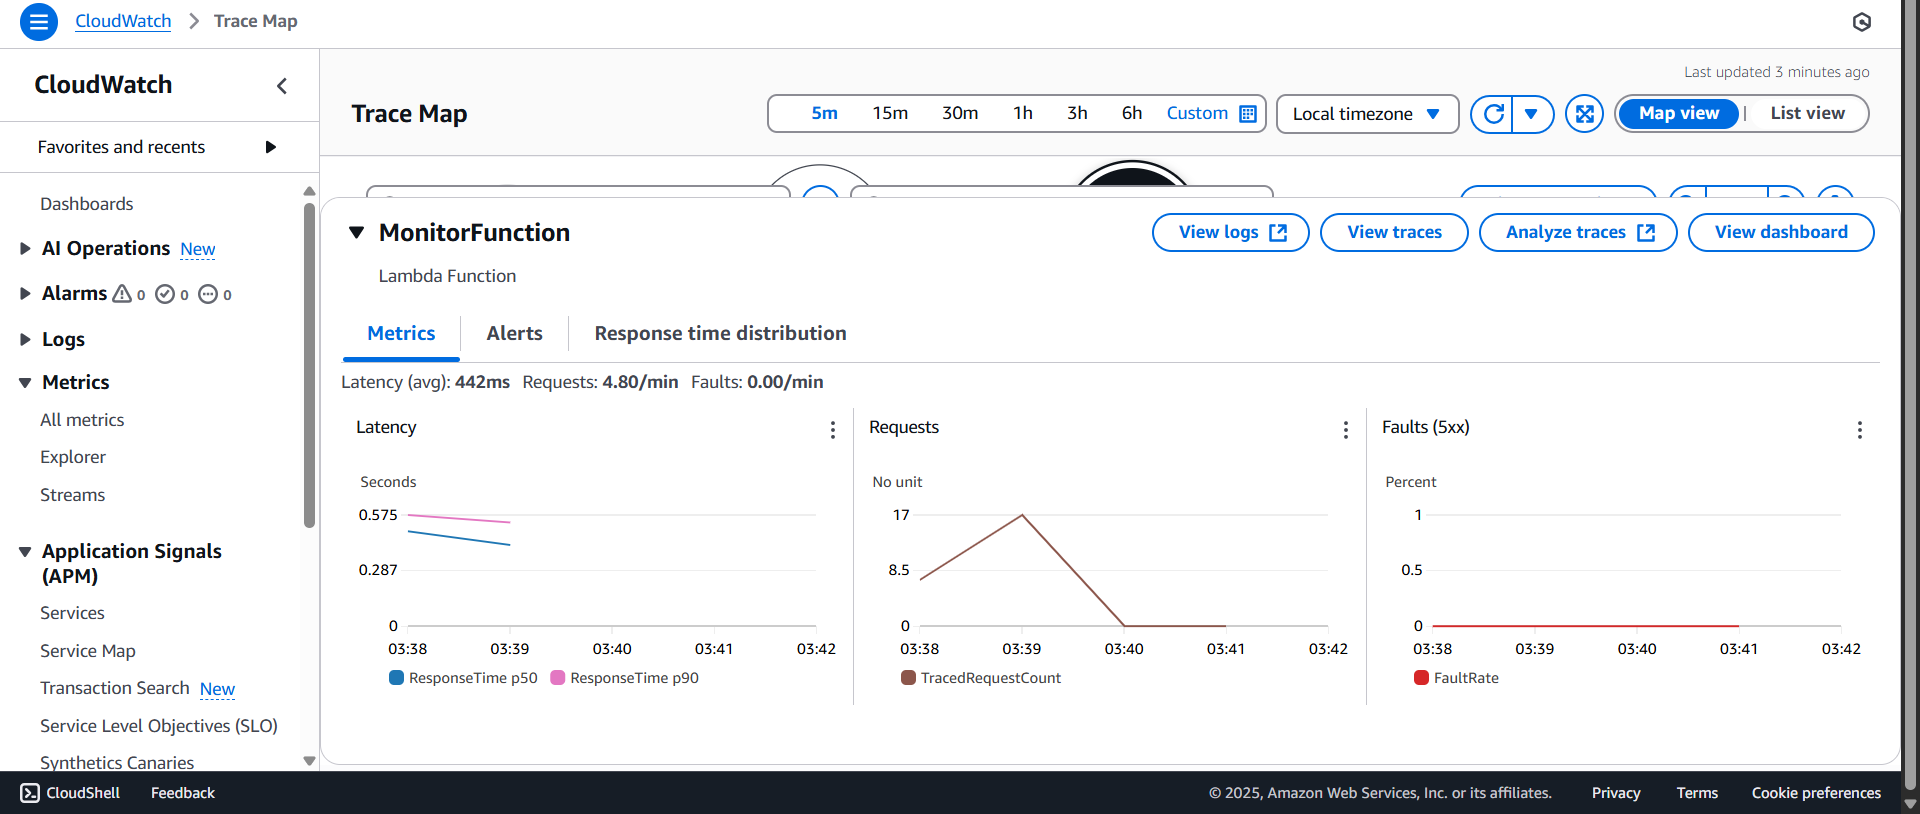
- The details of the selected Lambda Function will appear, including options for Metrics, Alerts, Response time distribution — click on Metrics
- View metrics such as Latency (avg), Requests, Faults
- Check the graphs for Latency (avg), Requests, Faults
- Click on Response time distribution, and note that the average response time is around 4%
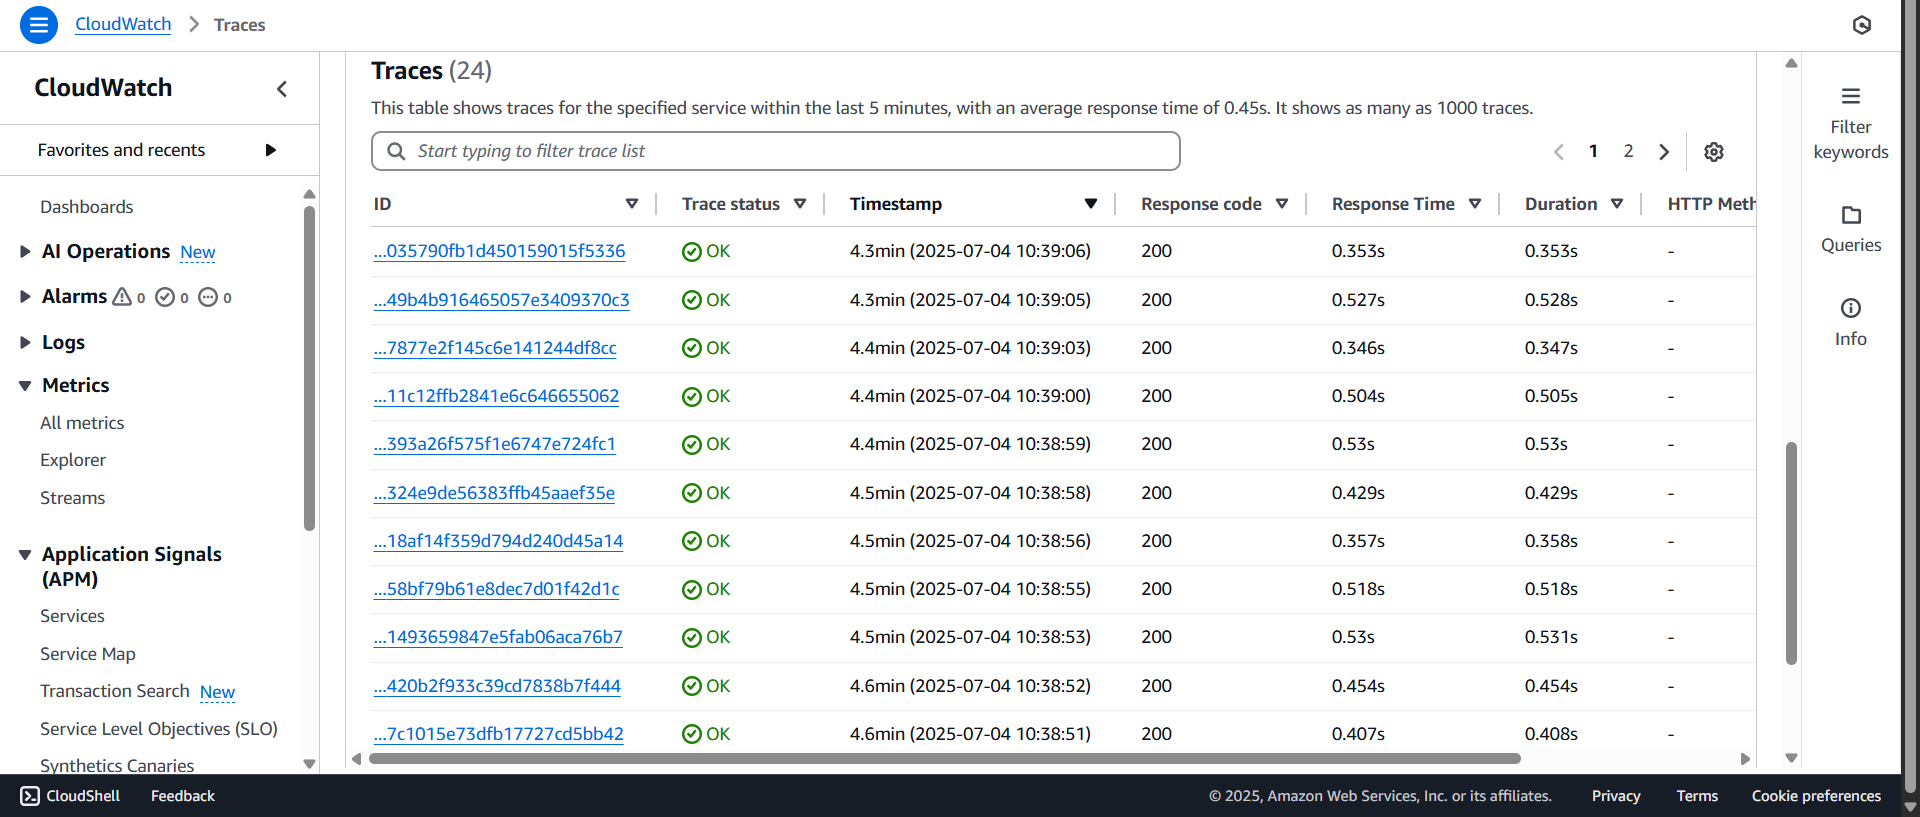
- Click View traces to see detailed trace data
- The Traces interface appears. Browse through the traces and review important metrics.
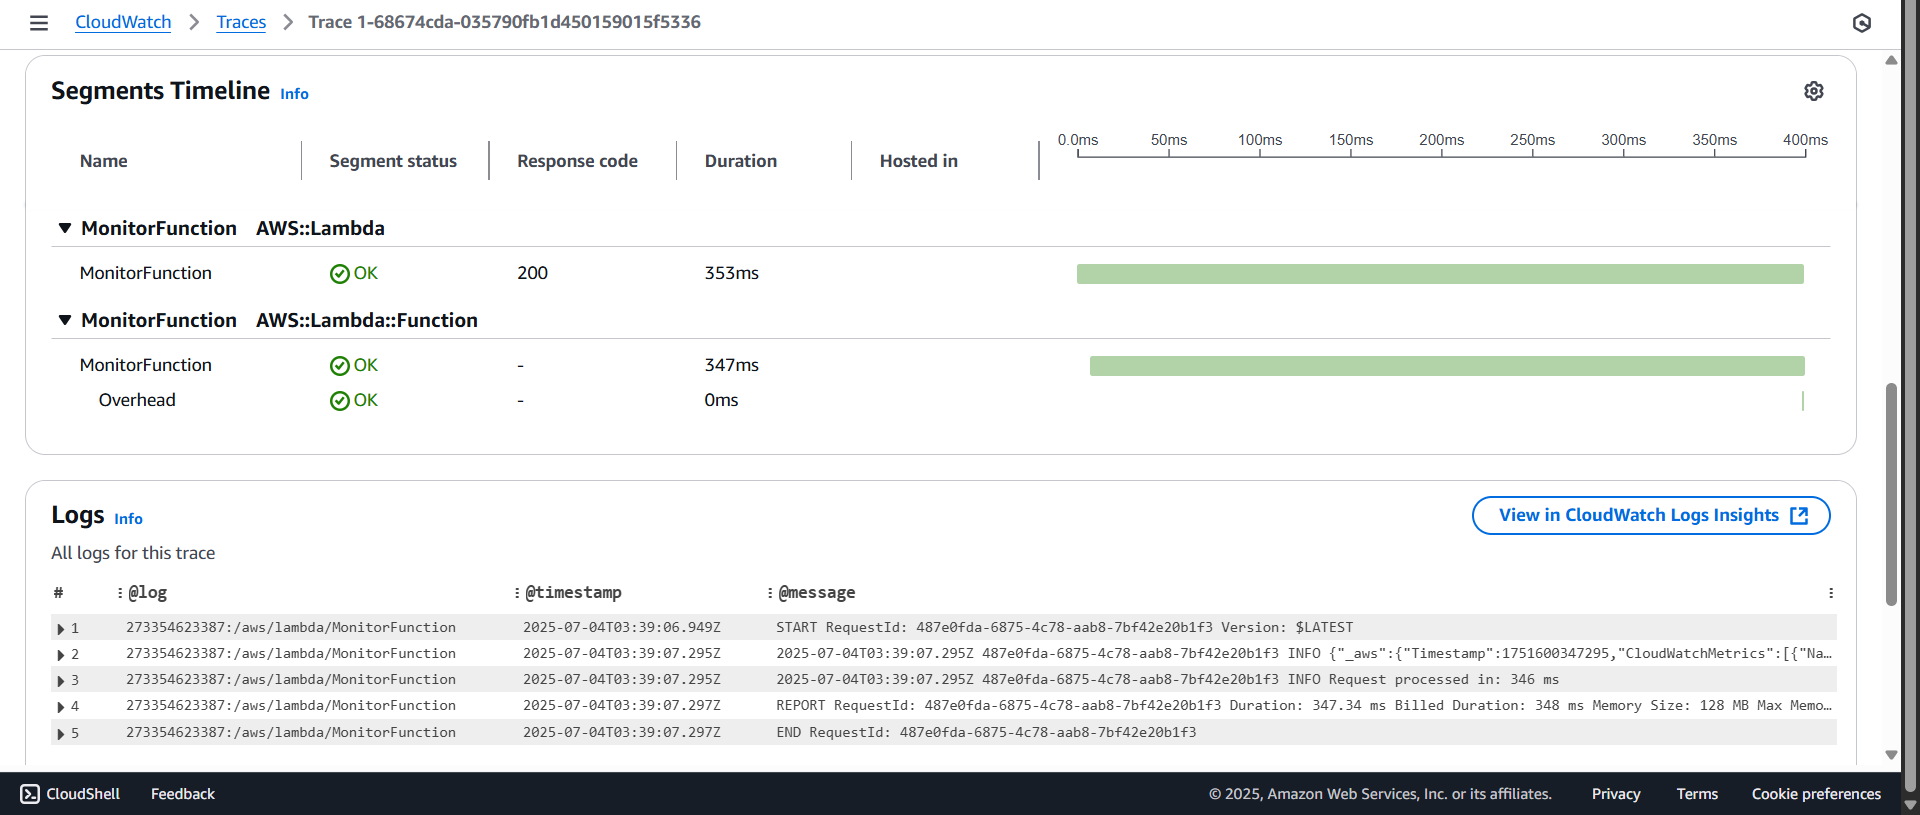
- Click on any trace to view the detailed breakdown:
- Return to the Traces interface and click Refine query by
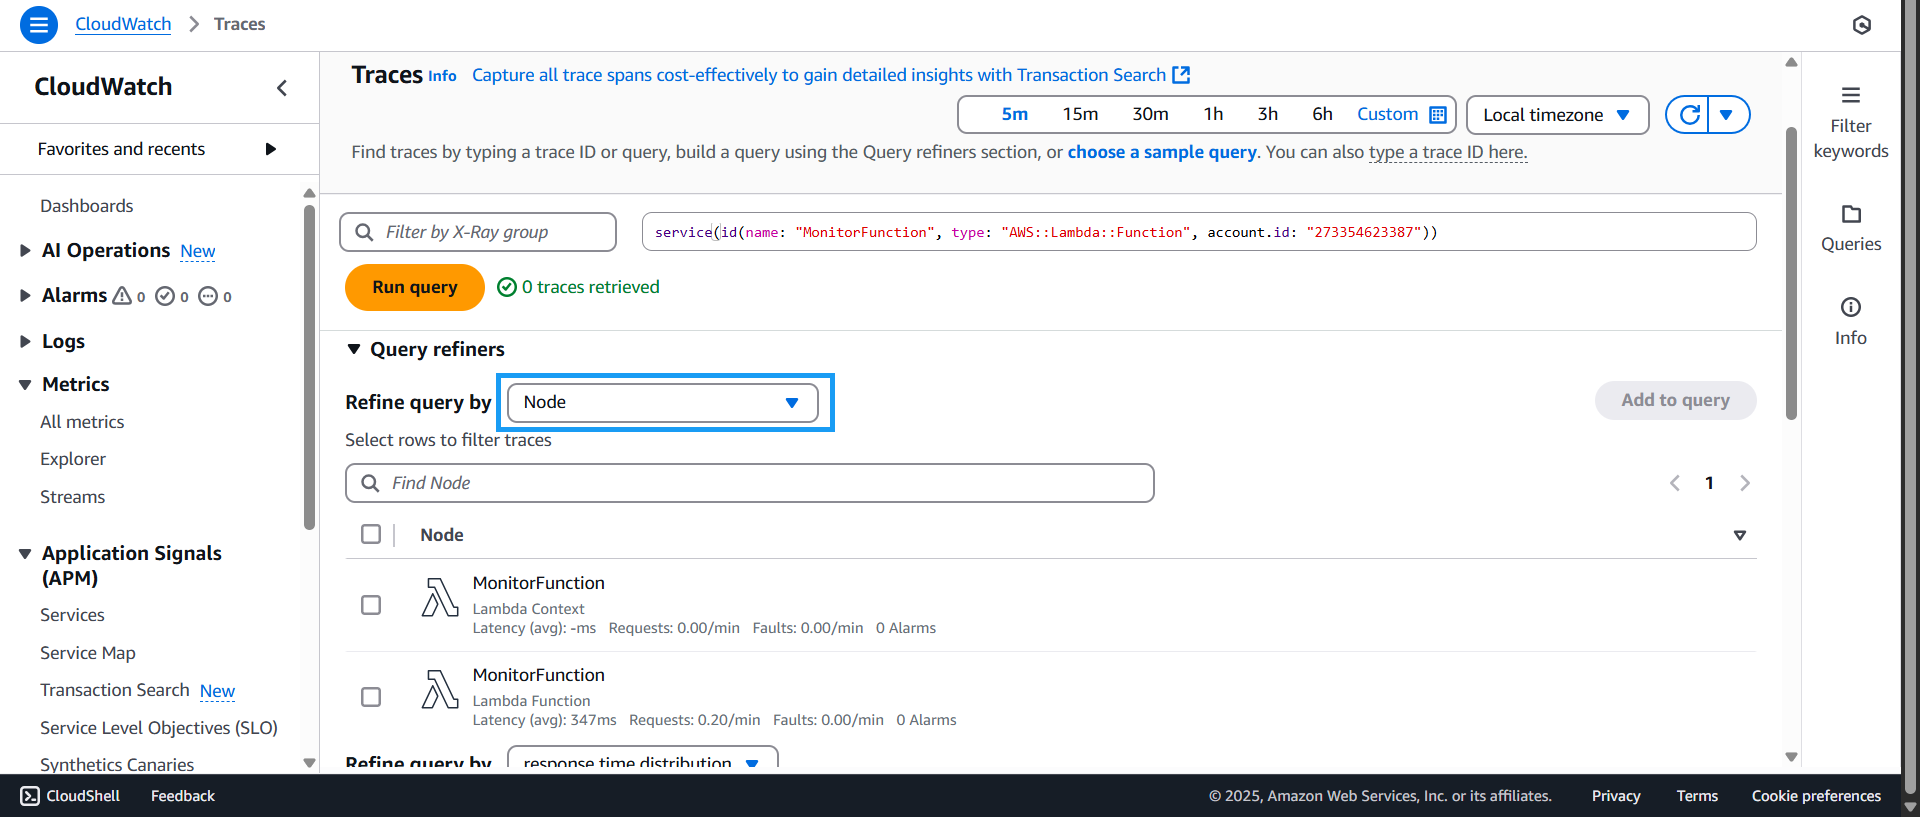
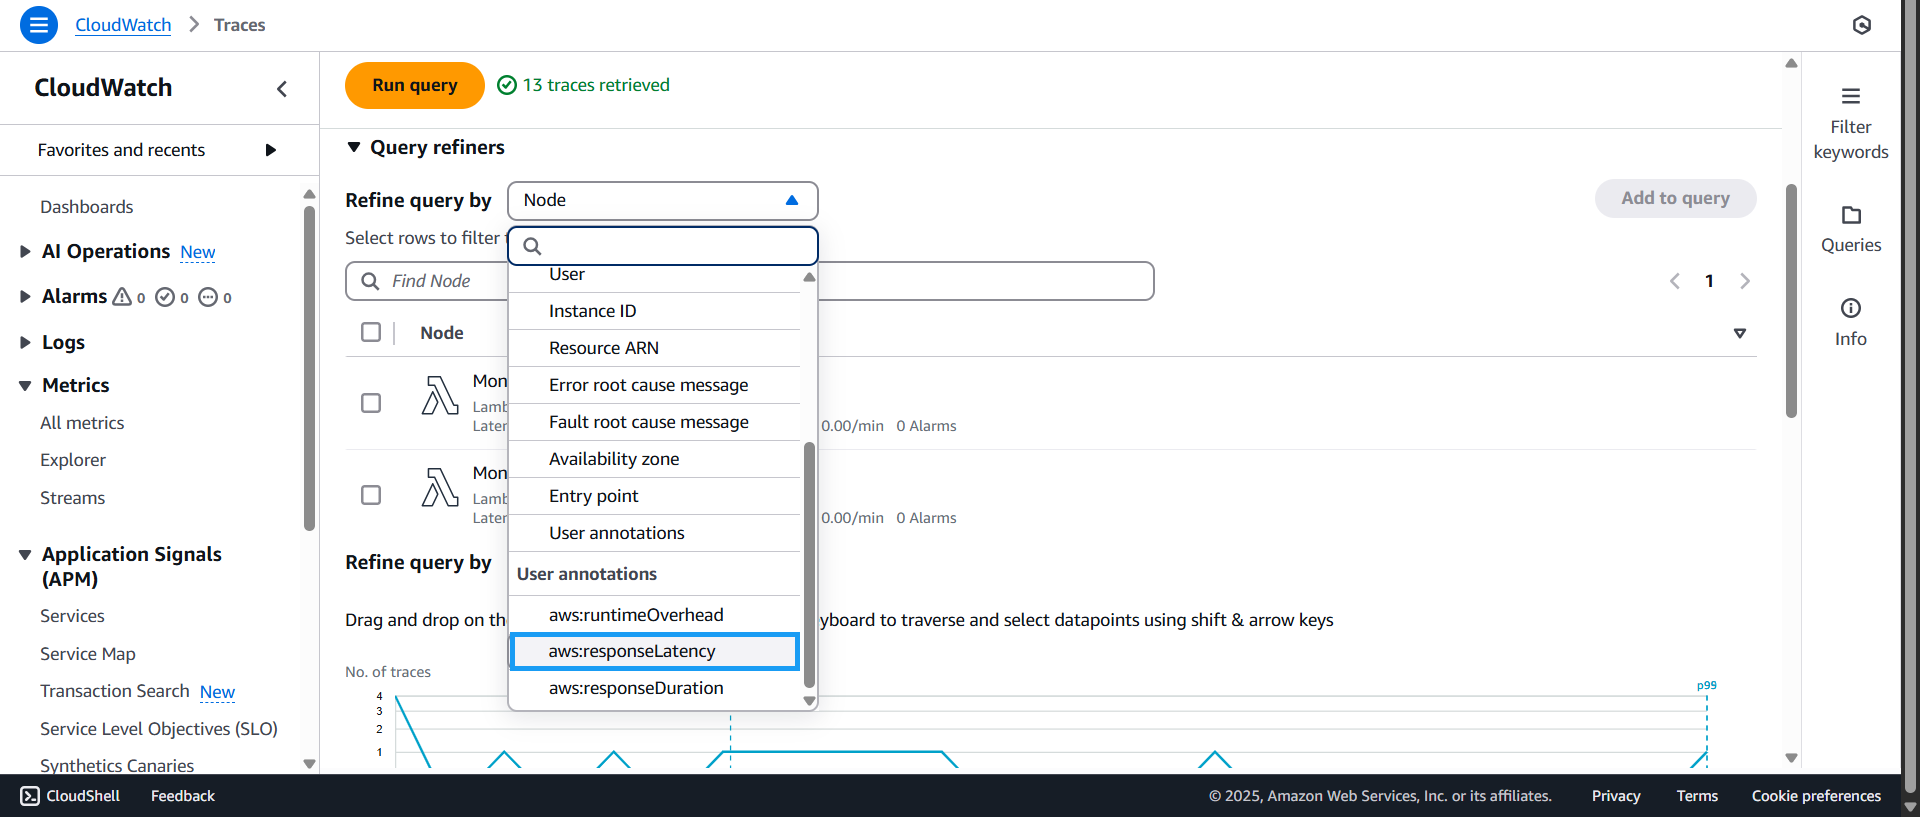
- In the User annotations section, choose
aws:responseLatency. This is a key metric showing how long a request takes to process. Based on this, you can evaluate the application’s performance.
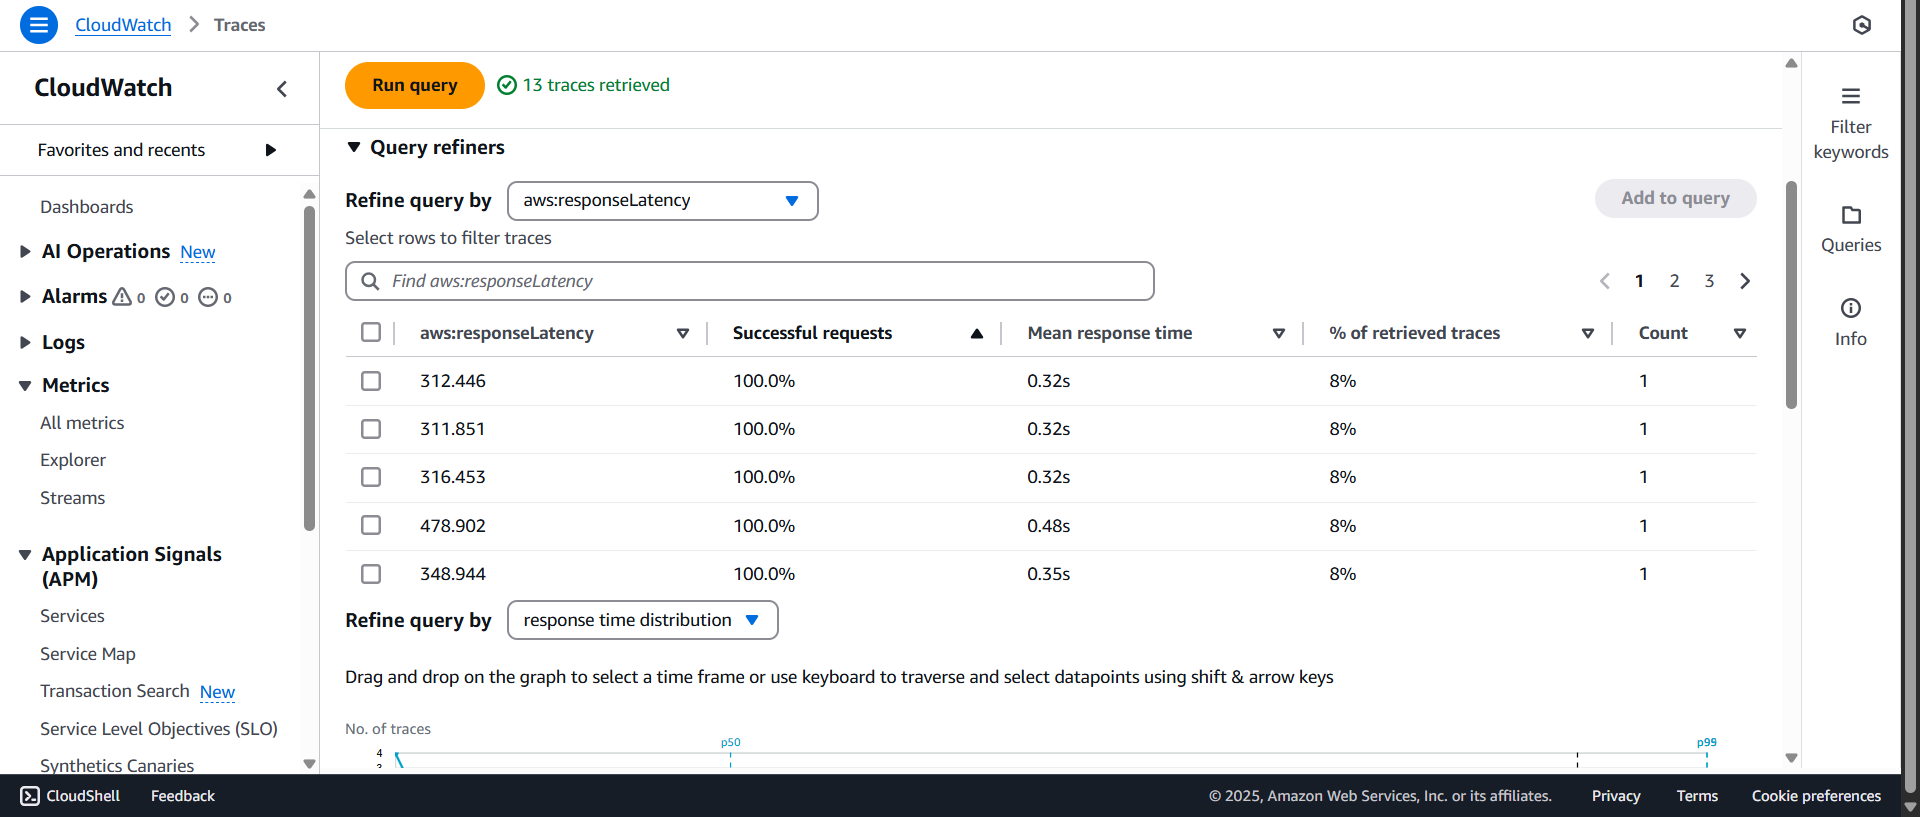
- A table of traces will appear, sorted by descending latency. From this, you can see that the application has a peak latency of 312.446 ms, which helps prepare for potential overload situations — when traces gradually exceed latency thresholds.
That concludes the Monitoring and Analysis section. In the next part, we’ll move on to monitoring performance with CloudWatch Custom Metrics.