Create a Lambda Function with Tracing
In this step, you will create a serverless application with tracing enabled to monitor the process when a user makes a request to the application.
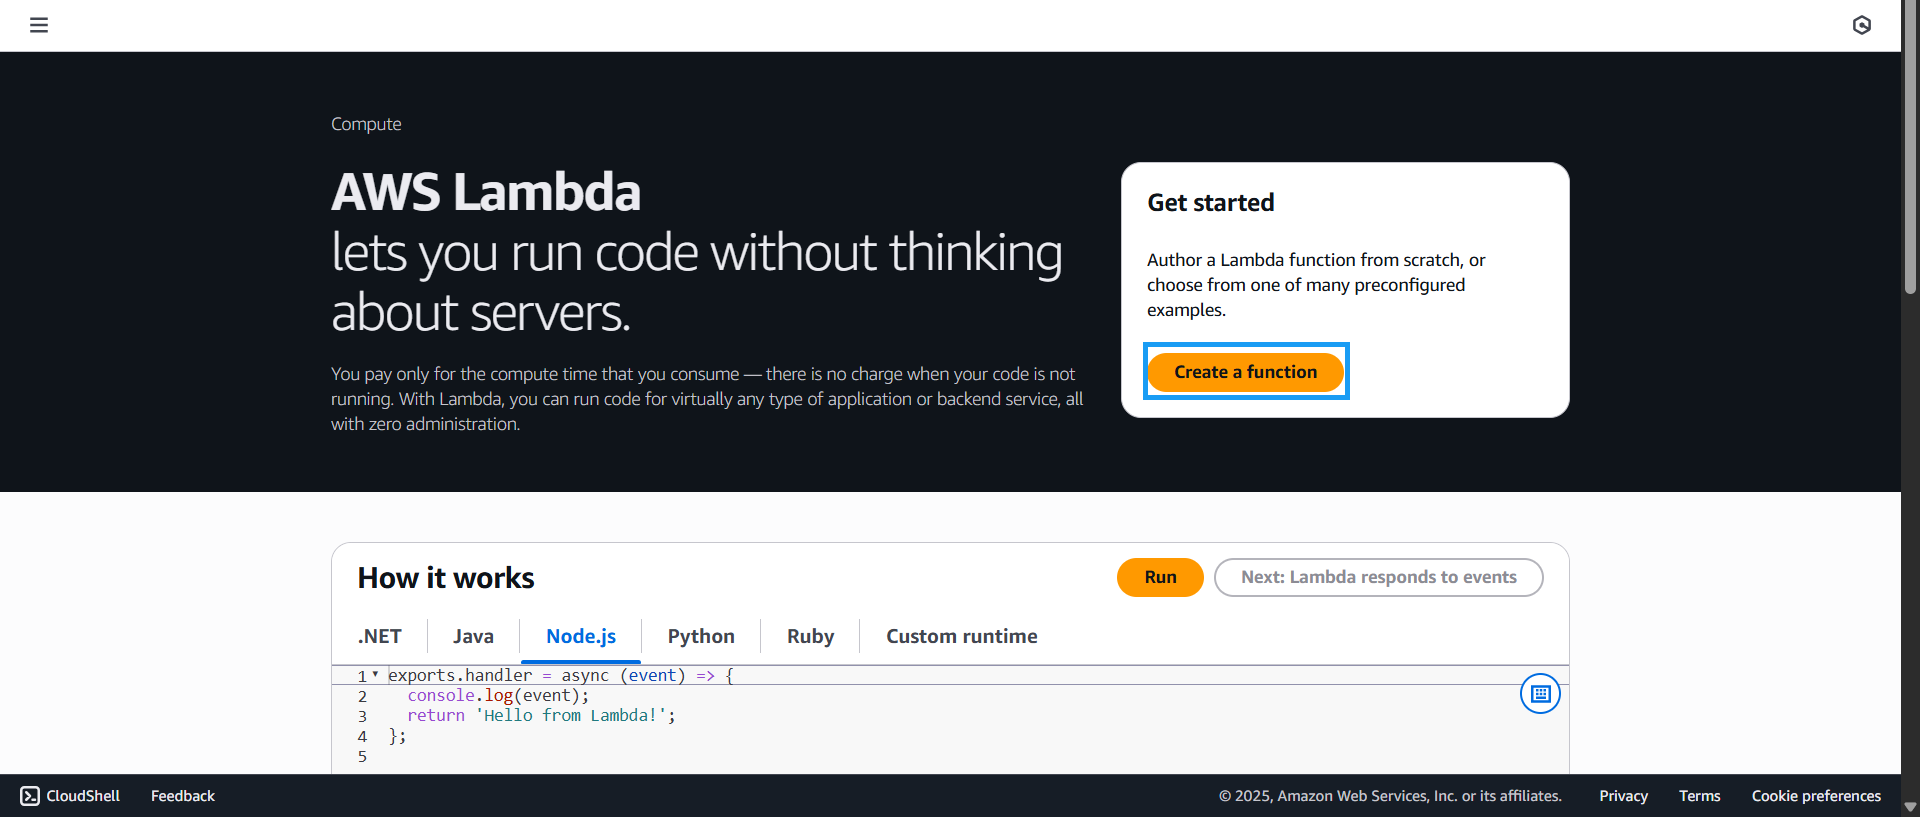
- Go to the AWS Lambda Console and click Create a function
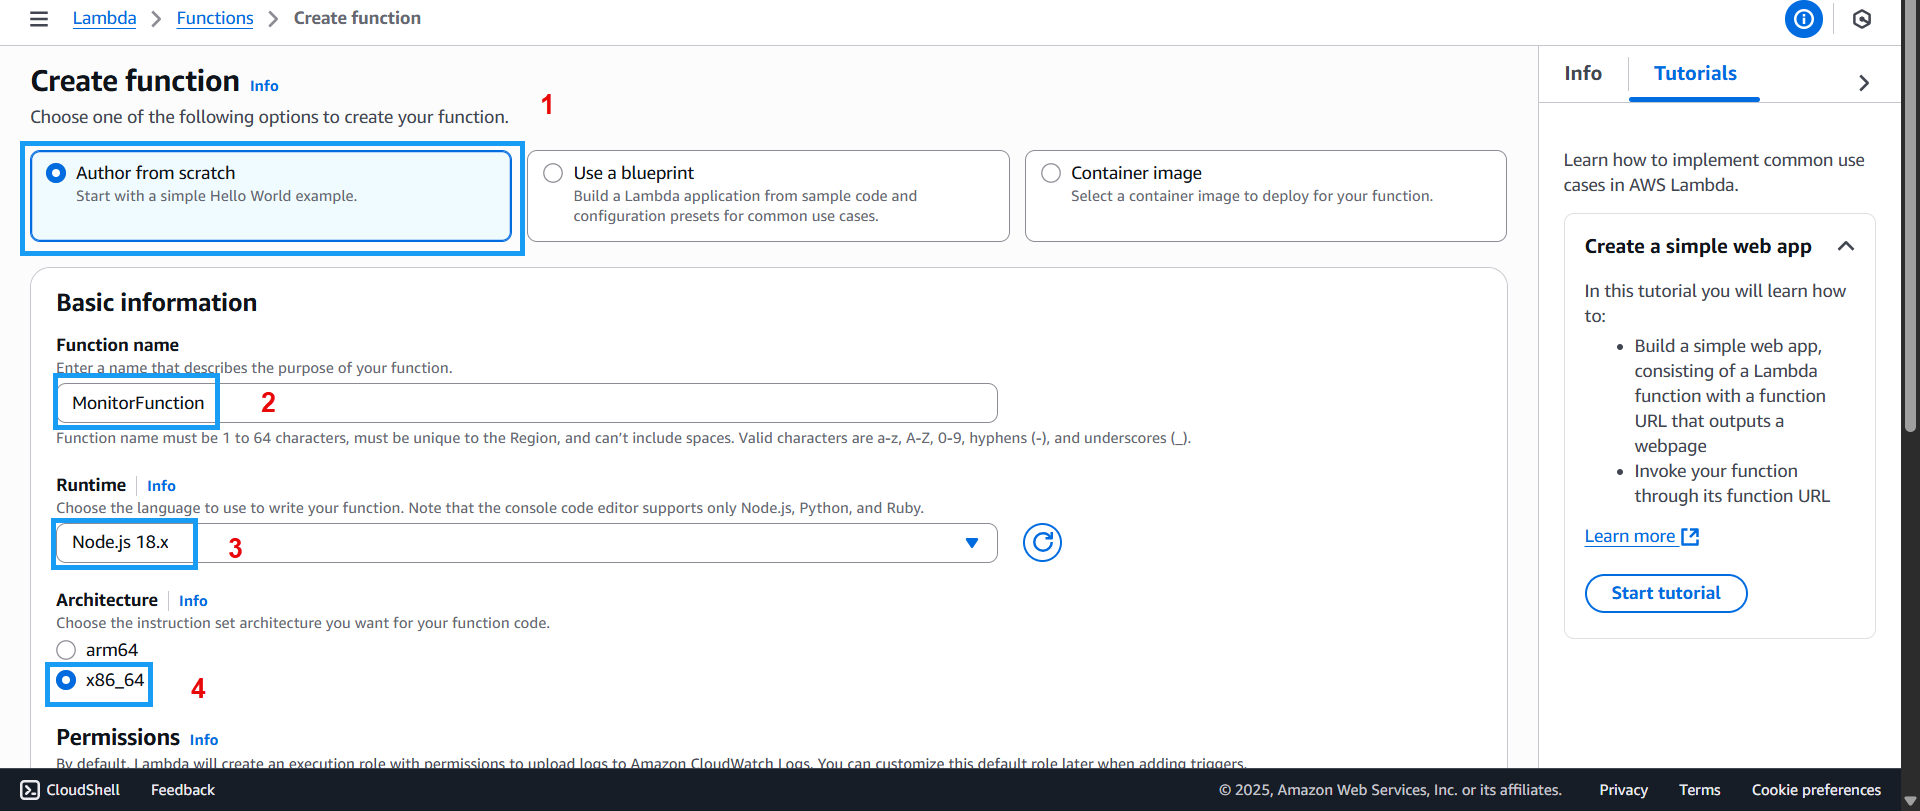
- The Create function interface appears:
- Select Author from scratch
- Enter MonitorFunction as the Function name
- For Runtime, choose the latest Node.js version
- For Architecture, select x86_64
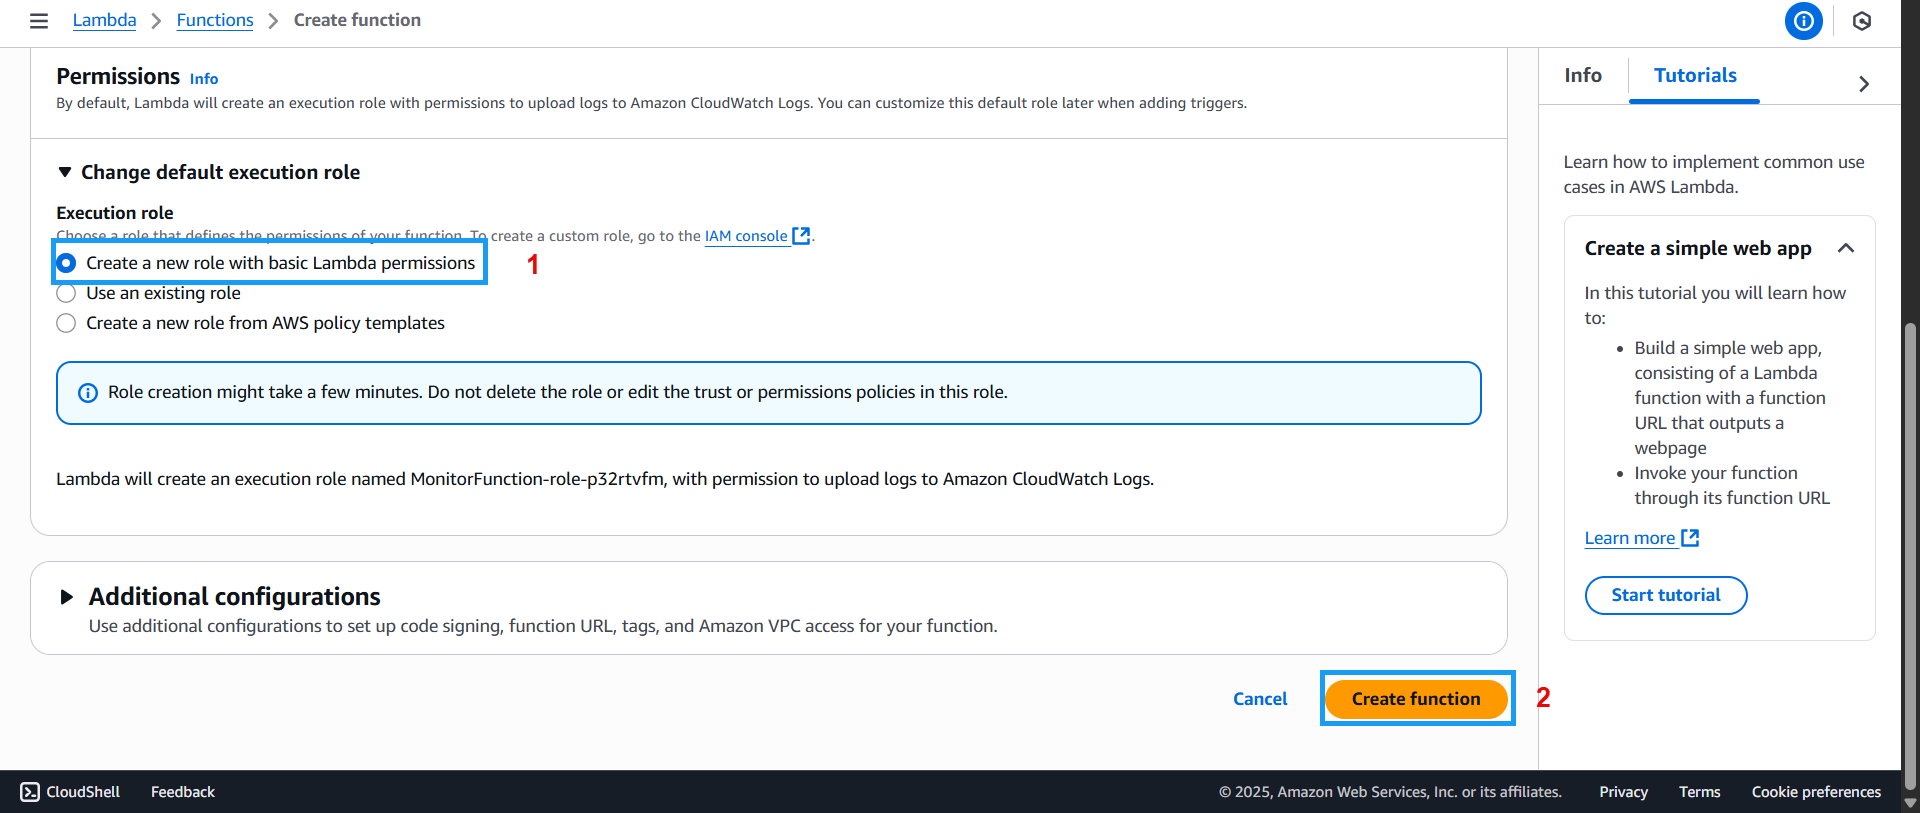
- Scroll down a bit further:
- Select Create a new role with basic Lambda permissions
- Click Create function
- Once done, the newly created function will appear:

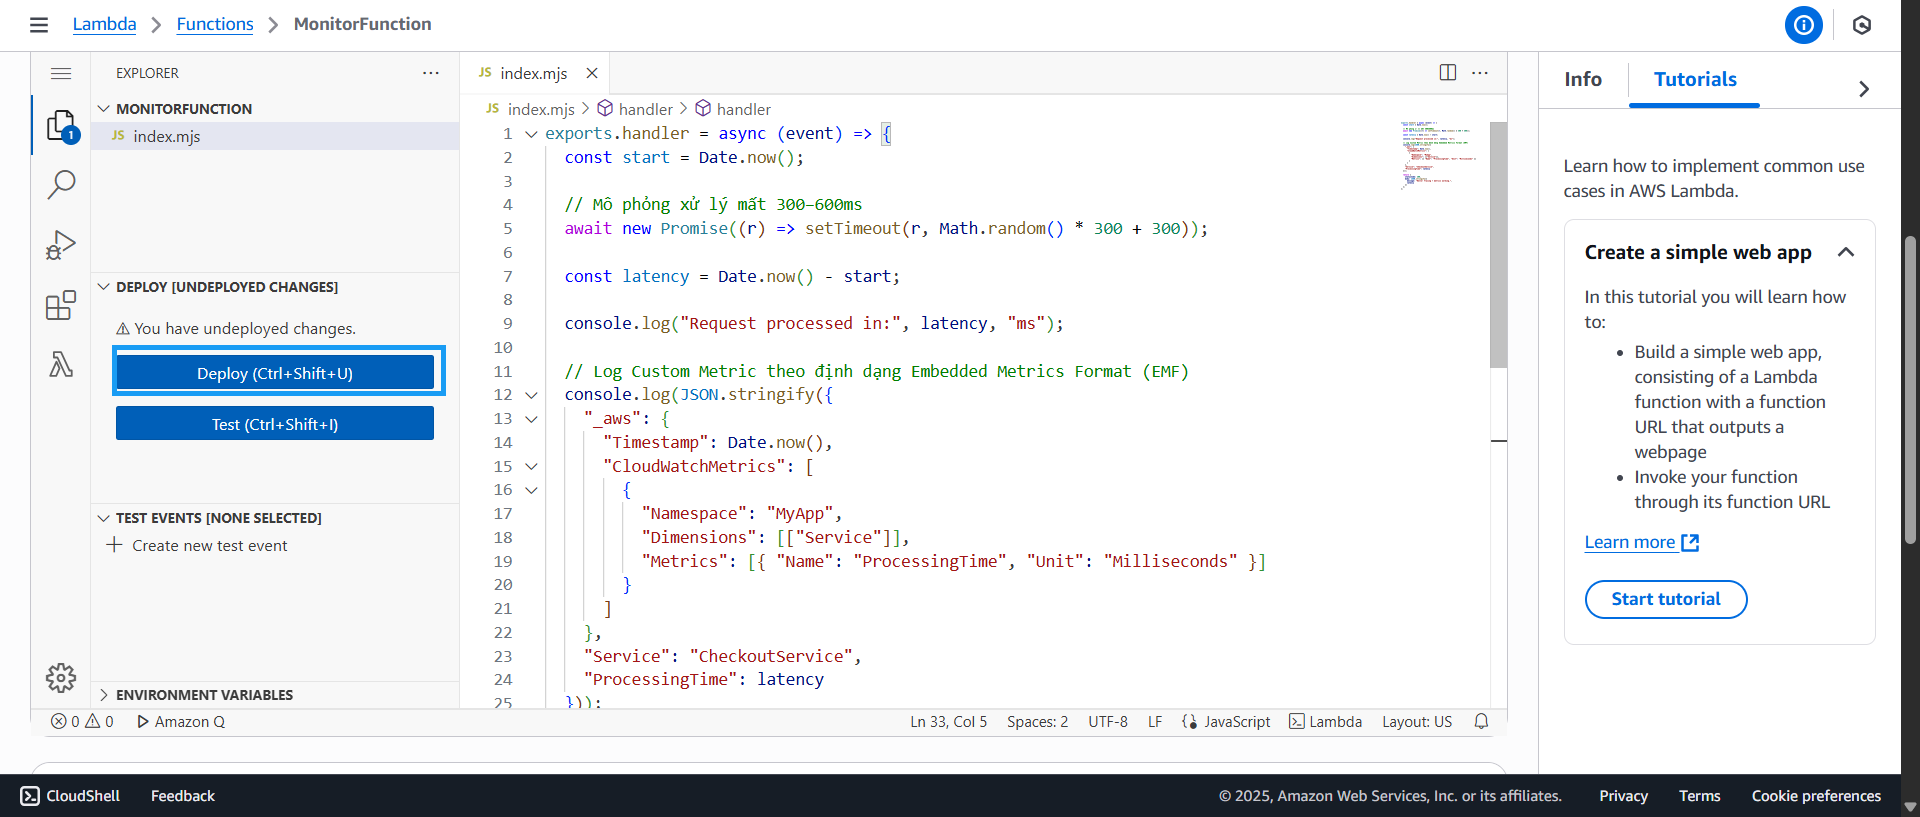
- Click the Code tab
- Paste the following code and click Deploy
  export async function handler(event) {
      const start = Date.now();

  	  await new Promise((r) => setTimeout(r, Math.random() * 300 + 300));
  	  const latency = Date.now() - start;

  	  console.log("Request processed in:", latency, "ms");

  	  console.log(JSON.stringify({
  	    "_aws": {
  	      "Timestamp": Date.now(),
  	      "CloudWatchMetrics": [
  	        {
            "Namespace": "MyApp",
	          "Dimensions": [["Service"]],
	          "Metrics": [{ "Name": "ProcessingTime", "Unit": "Milliseconds" }]
	        }
	      ]
	    },
	    "Service": "CheckoutService",
	    "ProcessingTime": latency
	  }));

	  return {
	    statusCode: 200,
	    body: JSON.stringify({
	      message: "Hello! Tracing + metrics working.",
	      latency
	    })
	  };
  }
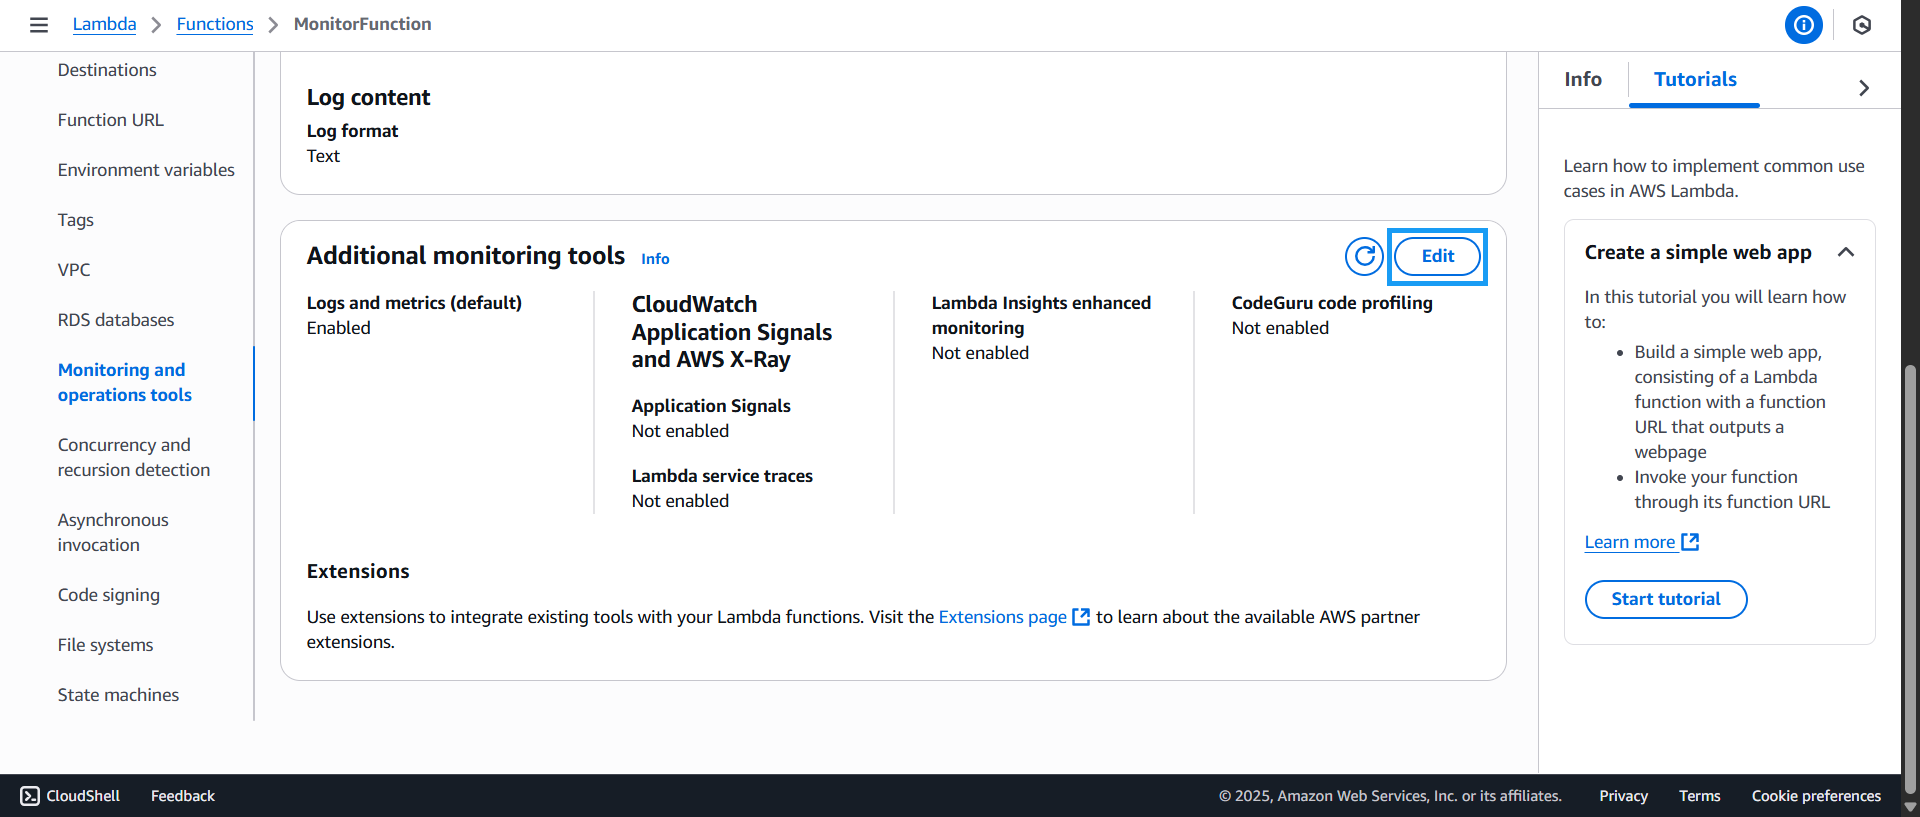
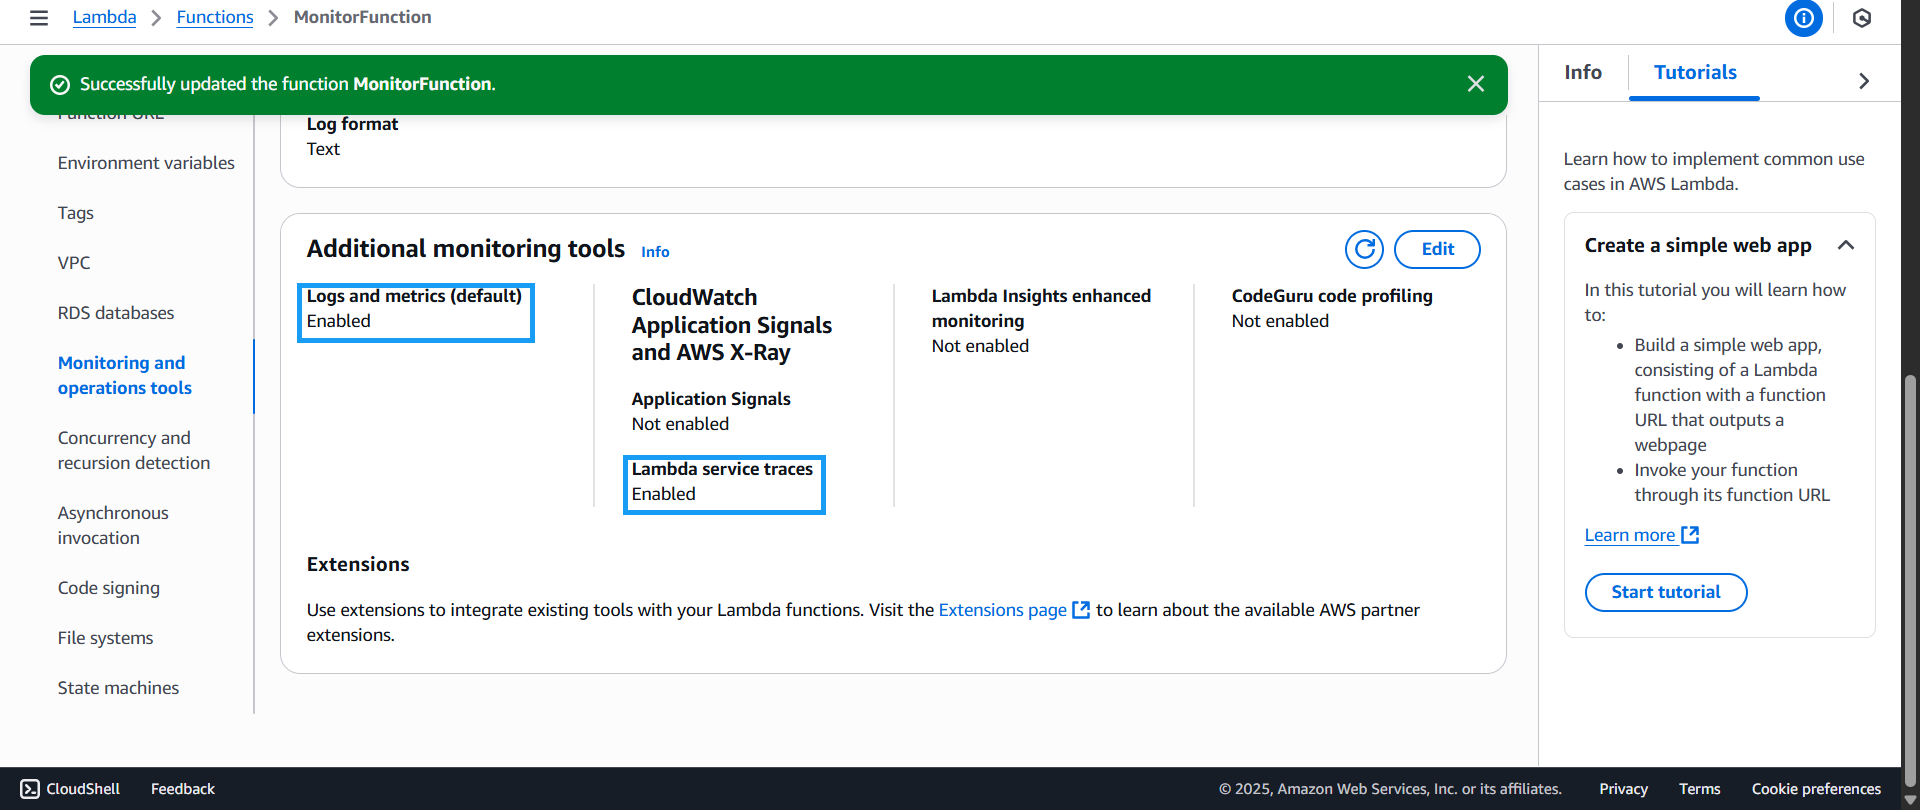
- Click the Configuration tab and then go to Monitoring and operations tools
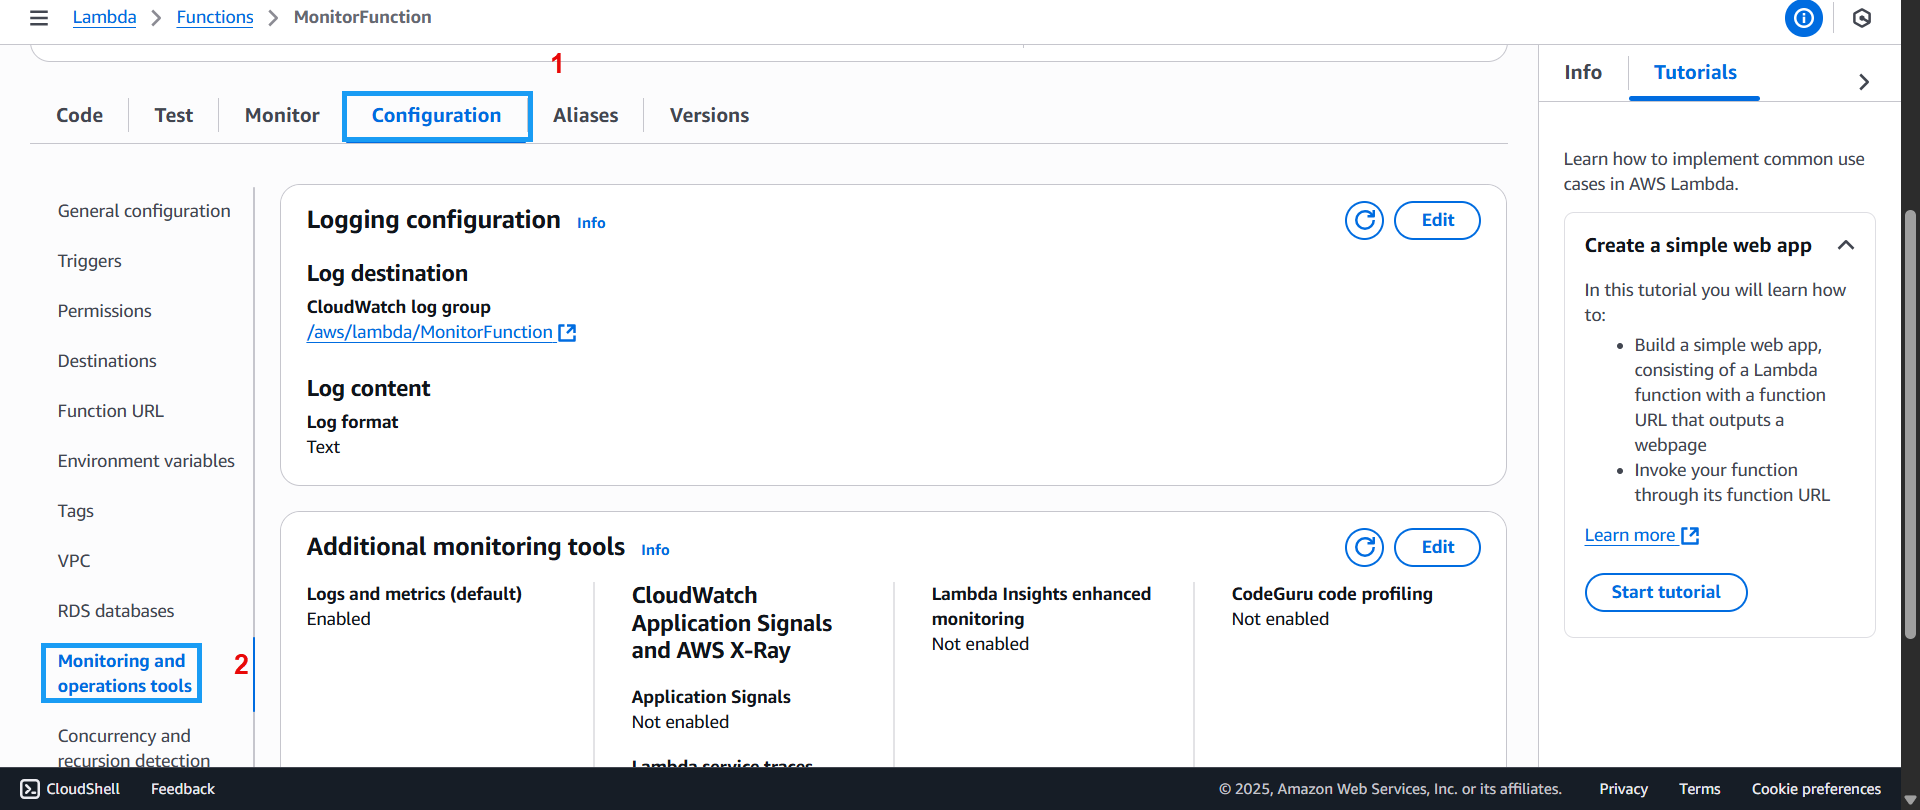
- In the Monitoring and operations tools section, click Edit
- The Edit monitoring tools interface appears. Under Lambda service traces, select Enable
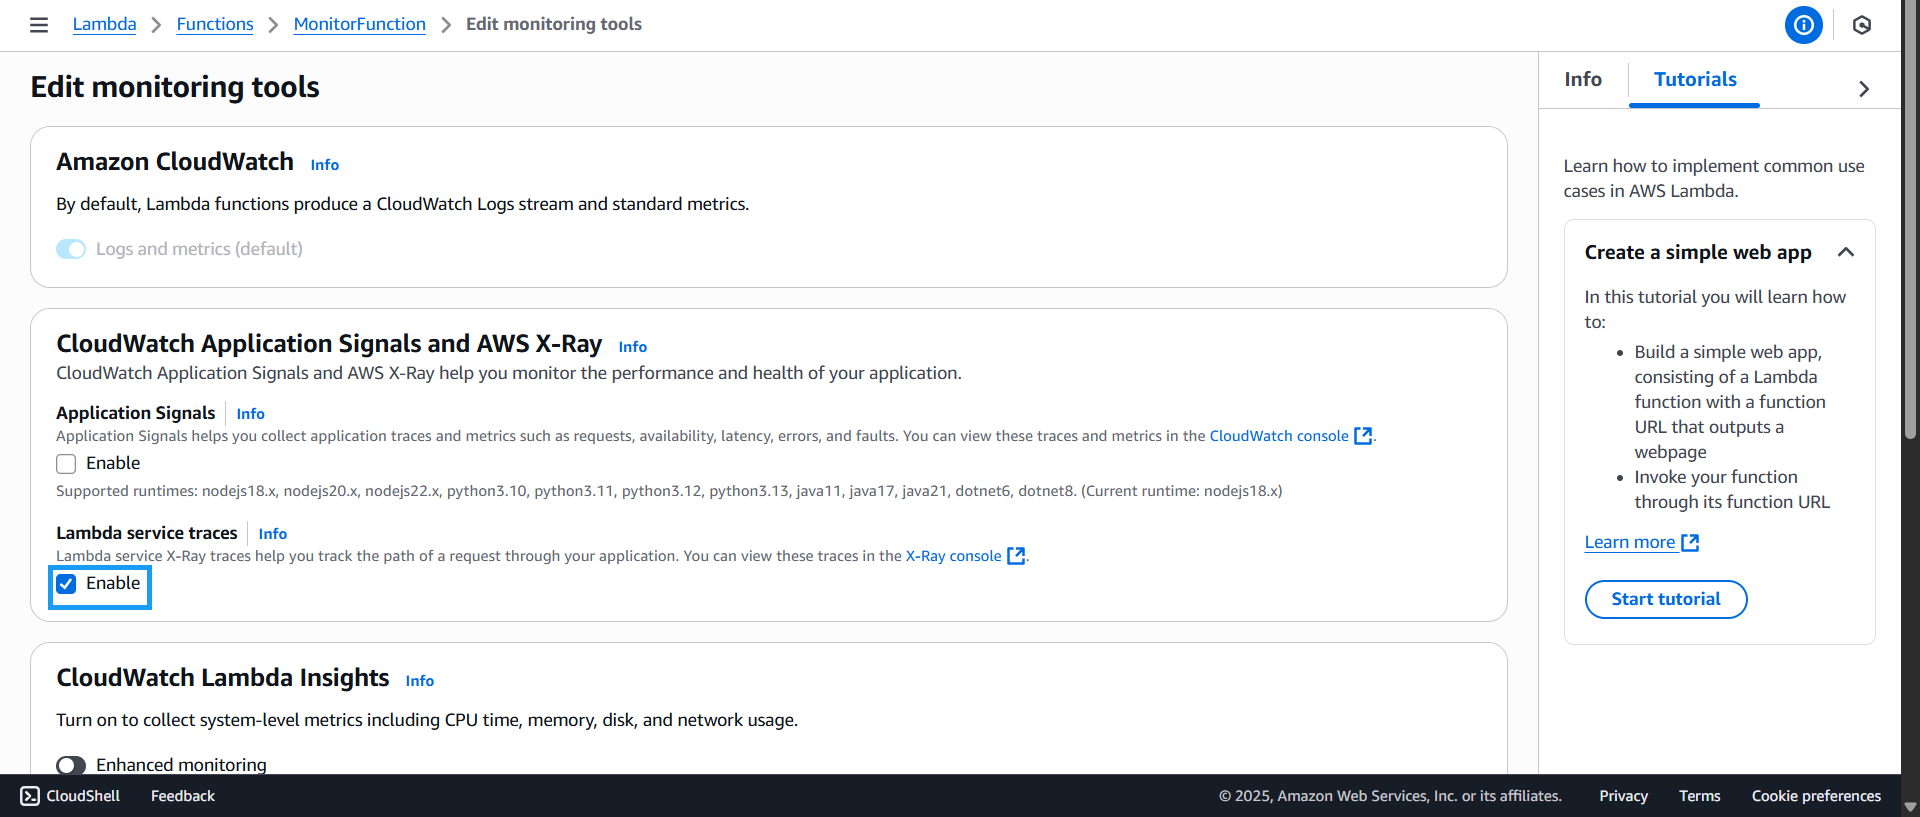
- Scroll to the bottom of the page and click Save

- A success message will appear:
- Under Logs and metrics (default), you will see Enabled
- Under Lambda service traces, you will also see Enabled
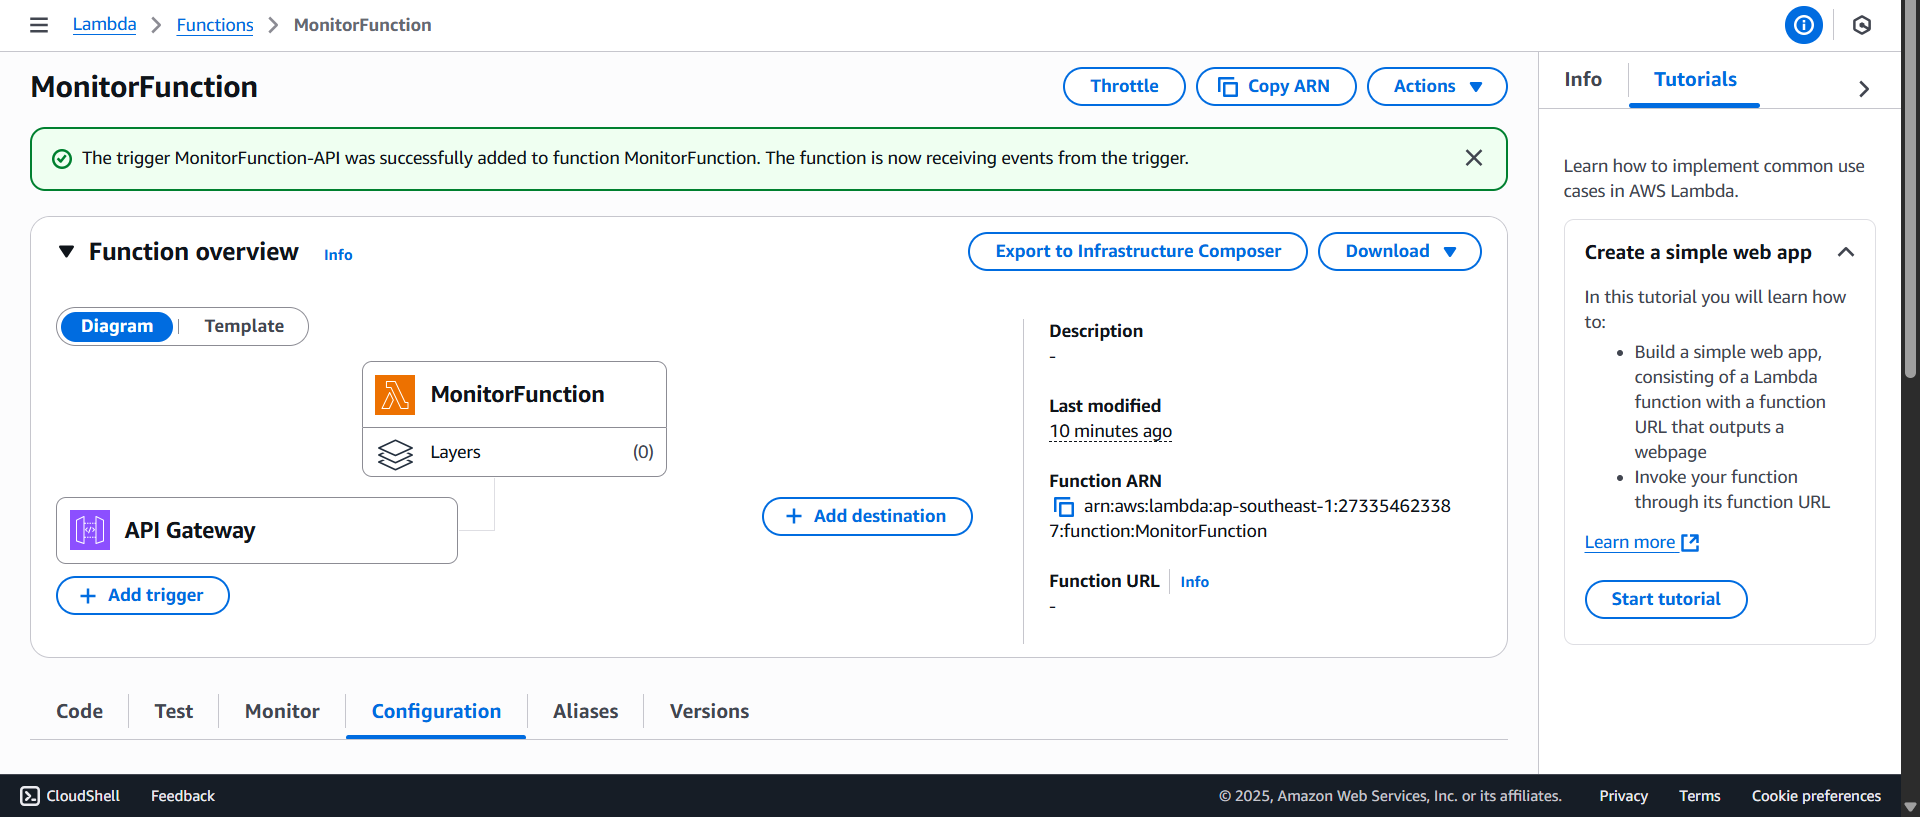
- Go back to MonitorFunction and click Add trigger
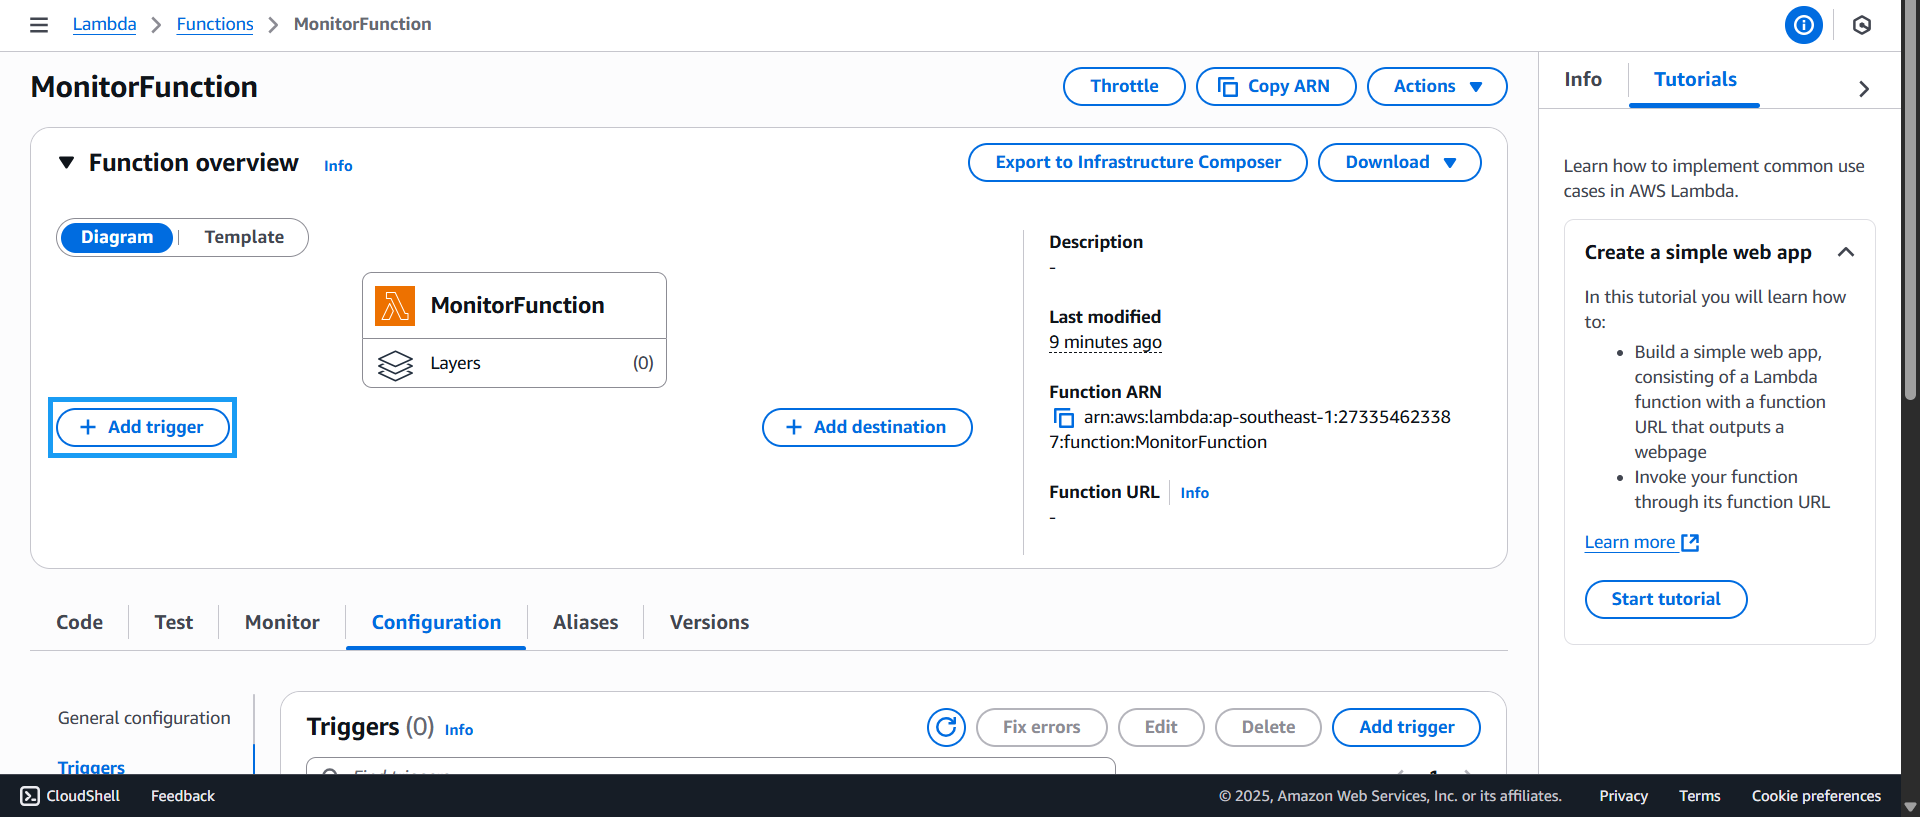
- The Add trigger interface appears:
- For Intent, select Create a new API
- For API type, select HTTP API
- For Security, choose Open
- Click Add

- A confirmation will appear indicating the trigger was successfully created: